With over 700,000 users, data from the app aquienvoto.org suggests how VAAs could represent a whole new way of surveying the general public before an election and collecting data on the political position of the population.
The creator of the app is BGSE alum Hugo Ferradáns ’15, graduate from the Economics of Public Policy Program. Follow him on Twitter @Hferradans.
The rise of the internet era opened a door for innovative ways to help voters be informed about their political choices prior to casting their ballot. During the past 2015 Spanish General Election, new tools such as aquienvoto.org (whodoivote.org in English), an app that matches users’ policy preferences with parties’ proposed policies, became an easy and straightforward alternative for users to explore their political position and compare it to that of the biggest parties. Its success, with over 800,000 users and more than 30 million responses, suggests how technology and the social sciences can work successfully together to create a more informed and accountable electorate, especially in a multiparty political system such as the Spanish one.
But encouraging are more informed electorate is not the only benefit of Voting Advice Applications. In fact, the large amount of data that is generated from online applications such as aquienvoto.org can be a source of analysis and study regarding why people make their choices1, as well as a way to estimate what users care most about in a real-time basis before an election. This article, thus, will try to shed light on the usefulness of Voting Advice Applications to gather data on the political positioning of users. I will show some of the results that were acquired from aquienvoto.org, both on the policy preferences of users and on their most politically-aligned parties.
But first things first- What is exactly aquienvoto.org?
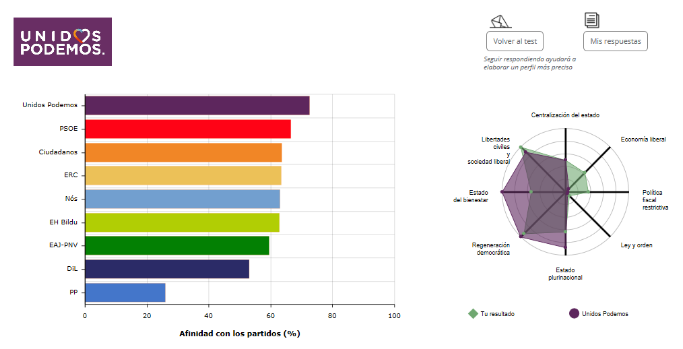
Aquienvoto.org is what is called in the field of political economy research a “Voting Advice Application” (VAA). VAAs are essentially an online test that matches users to parties depending on individual responses to policy-related statements. The user can either disagree or agree with the statements, as well as indicate whether that specific policy is important to him or her. After replying to several questions, the VAA gives the user a summary of what parties the user disagrees and agrees most with, mainly in the form of a ranking or a political map.

Even though there some VAAs more sophisticated than others2, all VAAs acquire essentially the same data:
- the position of the user regarding a specific question (in a scale of completely agree to completely disagree with the statement in question),
- whether that user gives importance to that question and
- after answering all questions, the ranking of most preferred parties for each user.
Aquienvoto.org was able to gather information on 756,908 people, after dropping all users that did not complete at least level 1 (that is, replied to 31 questions).
What did users get as an advice from aquienvoto.org?
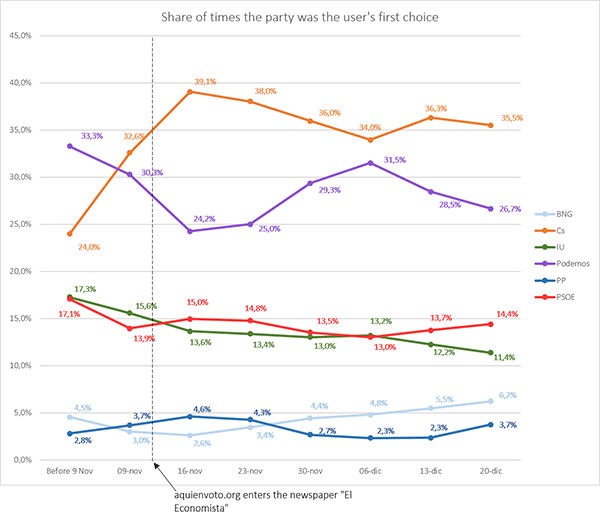
If we look at what party was the most first-ranked among users, we see that the centre-right Ciudadanos was the most preferred party throughout the whole period for roughly 33% of users. However, interestingly enough, the overall amount of people that voted for parties that are more leaned towards the left (Podemos,PSOE, United Left and Nós, representing 62.8% of votes) is much higher than those in line with liberal and conservative policies (Ciudadanos, PP, PNV and DiL, being 37.2% of users’ first choices), indicating that users from aquienvoto.org are consistently left-wing.

It is particularly noticeable the different layout that the results present when compared to the results from General Elections. For example, the conservative Partido Popular, which was ranked first in the elections with roughly 25% of votes, appeared last almost throughout the whole period for aquienvoto.org. It is clear that this might certainly come from the fact that VAA users are consistently younger and more left-wing than the average citizen, but it also poses a question that would be interesting to explore: do people vote in line with their policy preferences or are there other factors that are influencing voters’ decisions in the field of electoral politics?
How do people position themselves about certain issues and what they think are most important?
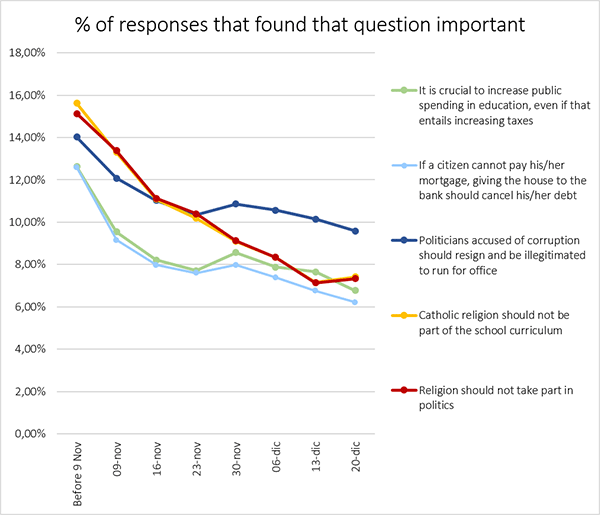
Unsurprisingly, the topics related to corruption were the ones users gave most importance to, with almost 10.67% of respondents (that is, 80,410 individuals) giving importance to the question “Politicians accused of corruption should resign and be illegitimated to run for office”, of which almost 93% of people responded that they agree or completely agree with the statement.
The second and third place of most-given-importance questions are related to the presence of religion in the political sphere (second place) and the presence of religion in the education curriculum (third place), for which both find a strong rejection towards religion. Furthermore, social policy is an area of much importance to individuals as well, surely very much related to Spain’s current economic woes. Indeed, Spanish law related to mass evictions over the past years3 takes fourth place in most-given importance question (8.06% of total questions replied), followed by a statement on the education budget (7,46%), for which most people agree that increasing the budget is a top priority within government policy. These results are roughly constant throughout time, although the amount of users that gave importance to questions declined (graph 2).

In terms of the most controversial topics out of all questions, where there are large amounts of people agreeing and disagreeing with the statement, we find the prohibition of bullfighting, the abolition of escuelas concertadas4 and the law regarding underage abortion5, having all of them a rather high rate of importance-responses as well.
Regarding what users are not interested on, that is, the questions that were least given importance to, it is seen that the four topics that are least important to users (starting from the least important) are the deficit and the ceiling of government expenditure, the legalization of prostitution, the regulation the financial sector, and the financing of the Autonomous Communities (the different regions of Spain).
What is the political position of the average user?
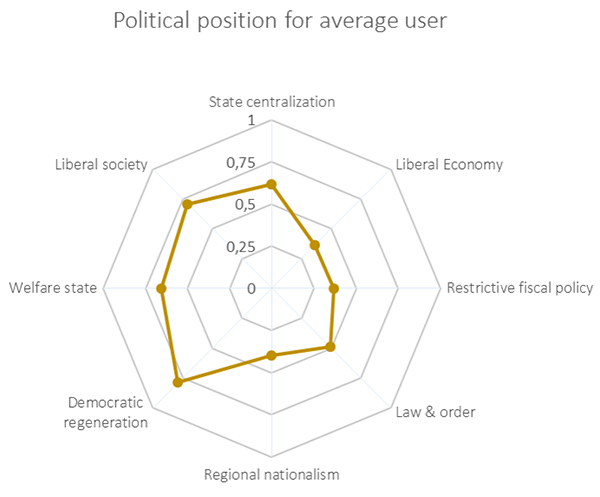
In order to give users the most interactive experience when analyzing their results, we created a map of their political position using eight different axis, as the Swiss VAA smartvote6 did. Using an algorithm, each response that a user gives contributes to create its “political map”, which can be later compared to the political map of the parties. Thus, using the responses from each user, we computed the political map for the average user, creating the image below.

As it can be seen, the average user is very much in favor of strong democratic institutions that condemn corruption at all levels, as it presents a rather high value for the axis related to democratic regeneration. Furthermore, it also presents a high value for welfare state and liberal society, and quite a low value for those questions supporting a liberal economy and a restrictive fiscal policy, which goes in line with the results mentioned above that users are more prone to identify themselves with left-wing policies.
Also, it can be seen that the average user rejects all statements related to regional nationalism, and favors those regarding state centralization. This changes, however, when comparing the average users from different regions, as people from Autonomous Communities such as Catalonia and the Basque Country strongly reject state centralization and favor regional nationalist policies.
What is left to be done from VAAs like aquienvoto.org?
Although VAAs can give academics a rich database, there are a number of methodological challenges that need to be overcome7, mainly regarding the representativeness of the sample. Indeed, if we want to make inferences on the positioning of the whole Spanish population, it is crucial that we acquire good quality data on the characteristics of users; something that has been proved difficult for online surveys. From aquienvoto.org, we are working to improve the process of data collection, providing users with the option to sign into an account where they can store their information and reply to surveys at any time. Nevertheless, we believe that more attention from Universities and governments should be given to these tools so that institutions and VAA organizations collectively work to make VAAs a better tool both for users and for the academia. Hopefully, that is what will happen in the next years to come.
For more information on the effect of VAAs on voting behavior, please check my article on Politikon
For inquiries on aquienvoto.org, please send an email to contacto@aquienvoto.org
- El auge de las aplicaciones de orientación del voto y su efecto en el comportamiento electoral, Politikon, June 2016.
- A review of the top Voter Advice Applications for the 2015 General Election, LSE British Politics and Policy Blog, April 2015.
- “If a citizen cannot pay his/her mortgage, giving the house to the bank should cancel his/her debt”
- An “escuela concertada” is a semi-private school that receives money from the government and at the same time charges fees to each student. It is unique to Spain.
- Whether underage girls should have permission from their parents by law to be able to have an abortion.
- https://www.smartvote.ch/
- Pianzola (2014), Selection biases in Voting Advice Application research.
