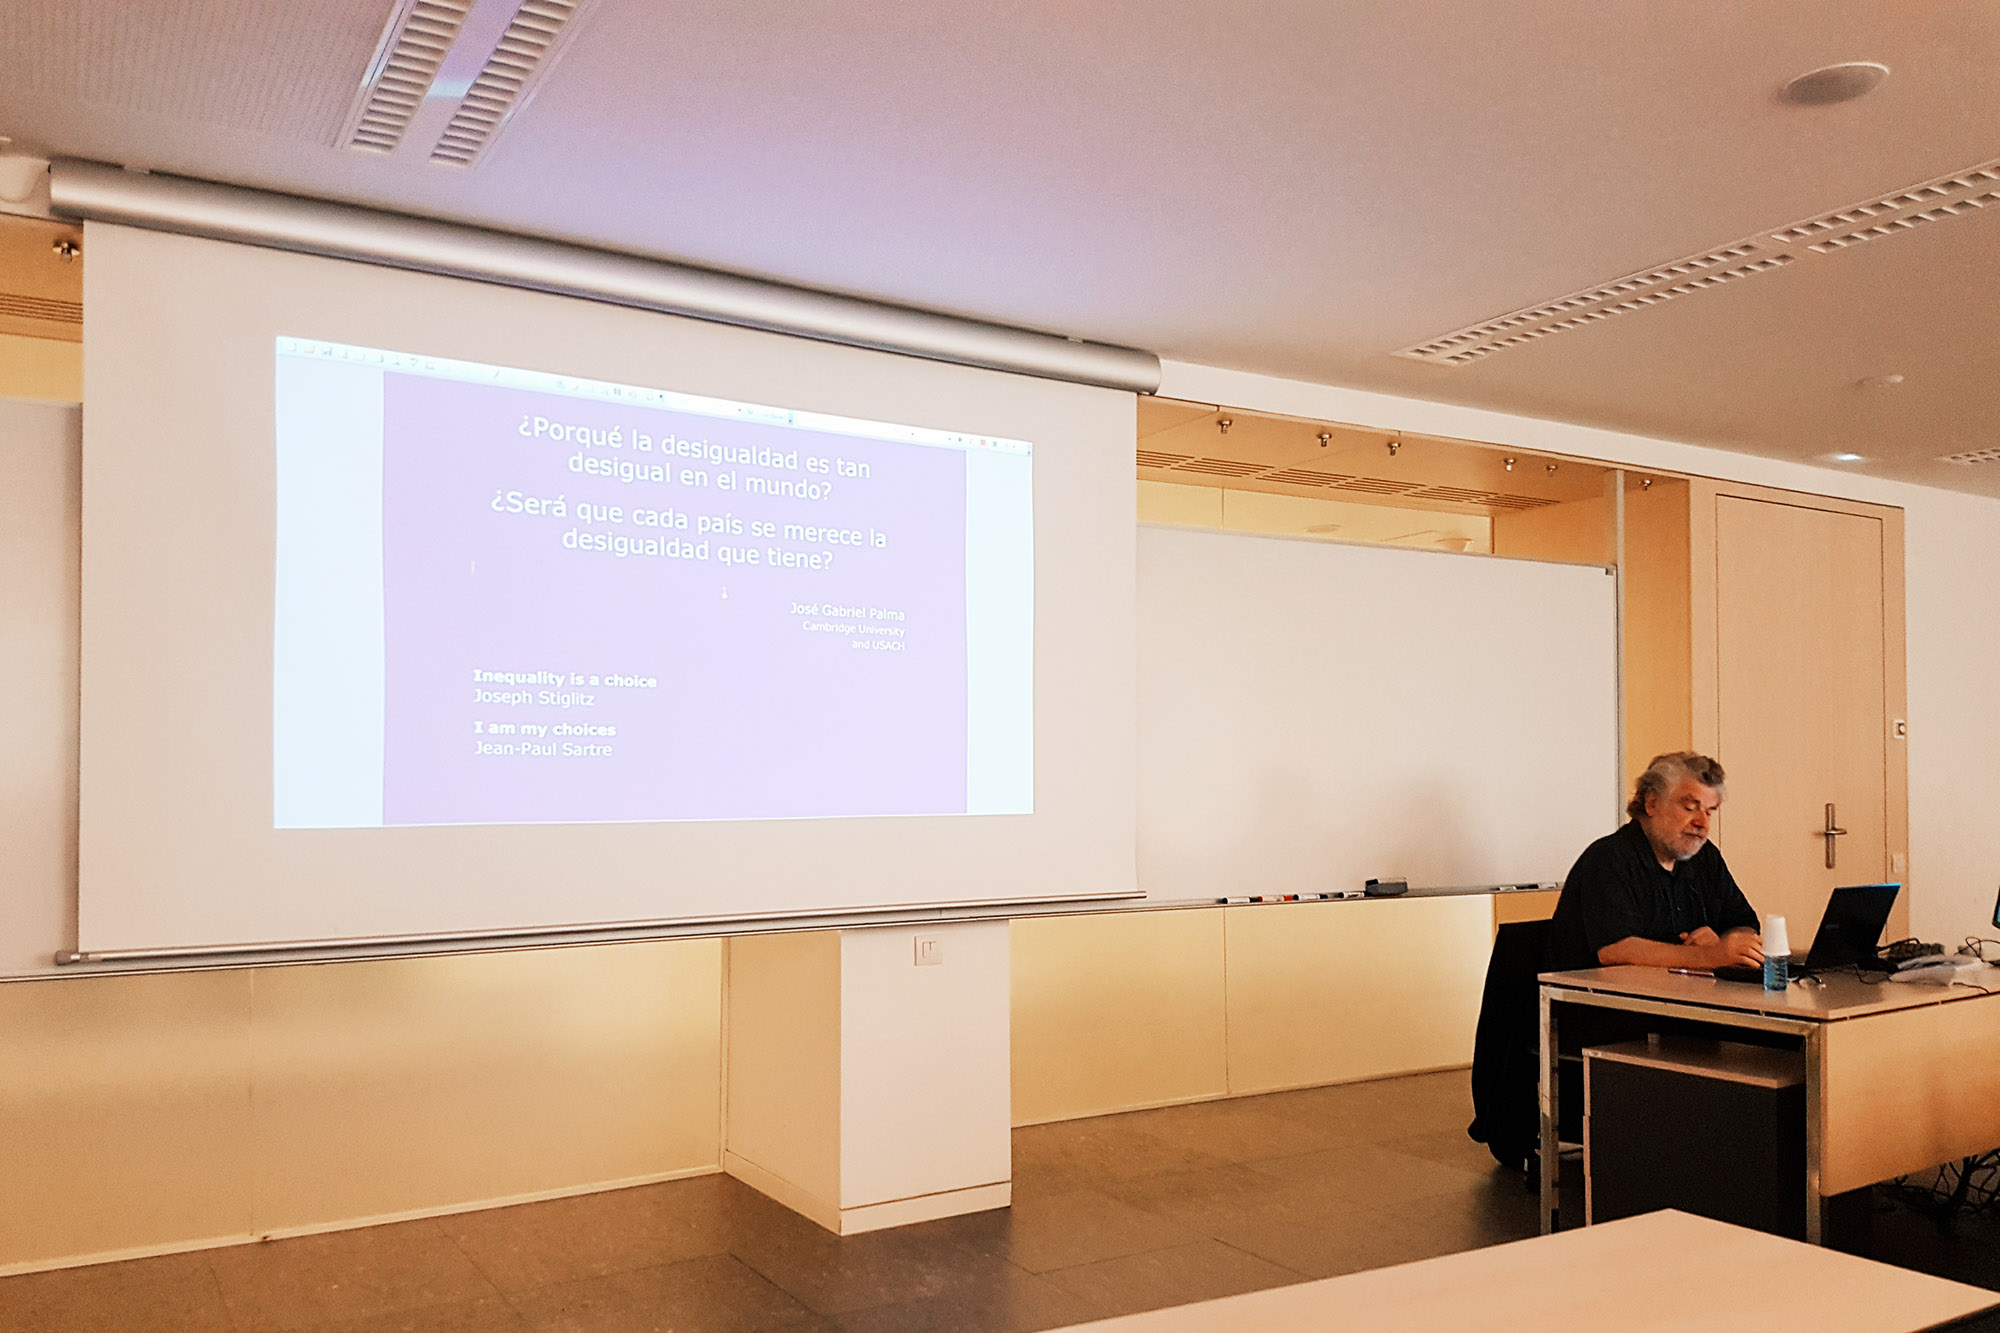
On 26 October 2016, Chilean economist Dr. José Gabriel Palma gave a lecture, organised by Institut Barcelona d’Estudis Internacionals (IBEI) – “Why is inequality so unequal in the world? Do Nations just get the Inequality they deserve?” During the lecture, he also presented his recently-published working paper, which re-examines the eponymous Palma Ratio [1].
Forces at work
In an earlier paper, published in 2011 [2], Dr. Palma had already highlighted the two forces pertaining to rising inequality across the world: ‘One is ‘centrifugal’, and leads to an increased diversity in the shares appropriated by the top 10 and bottom 40 per cent. The other is ‘centripetal’, and leads to a growing uniformity in the income-share appropriated by deciles 5 to 9’ (Palma, 2011). Decile 10 refers to the top 10 per cent, and deciles 5 to 9 can be interpreted as the middle-upper class. What this means is that the middle-upper class has been quite successful at protecting their shares, and anybody who genuinely wants to understand inequality within a country should really focus on the income-share of the top 10%. As Clinton’s campaign strategist put it crudely: “It’s the share of the rich, stupid.”
Gini or Palma?
The Gini coefficient, developed by Corrado Gini, is an index measuring income inequality, with 0 implying perfect equality, and 1 meaning perfect inequality. The Gini coefficient has been in use for a long time, but is not without its limitations. Atkinson (1970) [3] pointed out that the ‘Gini coefficient attaches more weight to transfers affecting middle income classes and the standard deviation weights transfers at the lower end more heavily.’ In other words, the Gini index is more sensitive to changes in the middle of the distribution, and less sensitive to changes at the top and bottom. Cobham and Sumner (2013) [4] have also echoed similar sentiments and criticised the use of the Gini index. They have in fact coined the term ‘Palma ratio’, which is ‘the ratio of the top 10% of population’s share of gross national income (GNI), divided by the poorest 40% of the population’s share of GNI’ (Cobham and Sumner, 2013).
Why might the Palma ratio be a more relevant indicator of the extent of income disparity in an economy? Why is there a growing consensus that the use of the Palma ratio is more appropriate in formulating policies that aim at reducing poverty? The answer is obvious – if an economy has a high Palma ratio, policy-makers can immediately focus on measures to narrow the gap between the top 10% and the bottom 40%. In Palma’s own words: ‘… … it measures inequality where inequality exists; it is also simple, intuitive, transparent and particularly useful for policy purposes’ (Palma, 2016). In contrast, the Gini index is likely to engender distortions because it reflects changes in the distribution where the probability of such changes (i.e. in the middle-upper class) is the lowest. This is such an important consideration that, during the lecture at IBEI, Dr. Palma cautioned his audience to ponder about norms versus distortions. Indeed, if we are often fixated on the middle-upper class, whose homogeneity is evident across the world, we might just be turning a blind eye to more serious concerns – the norms, that is, the (widening) gap between the extreme ends of the spectrum. In light of this, an inclusion of the Palma ratio in policy design will lead to desirable outcomes.
Other revelations
It is interesting to note that the Palma index has also revealed certain stylised facts.

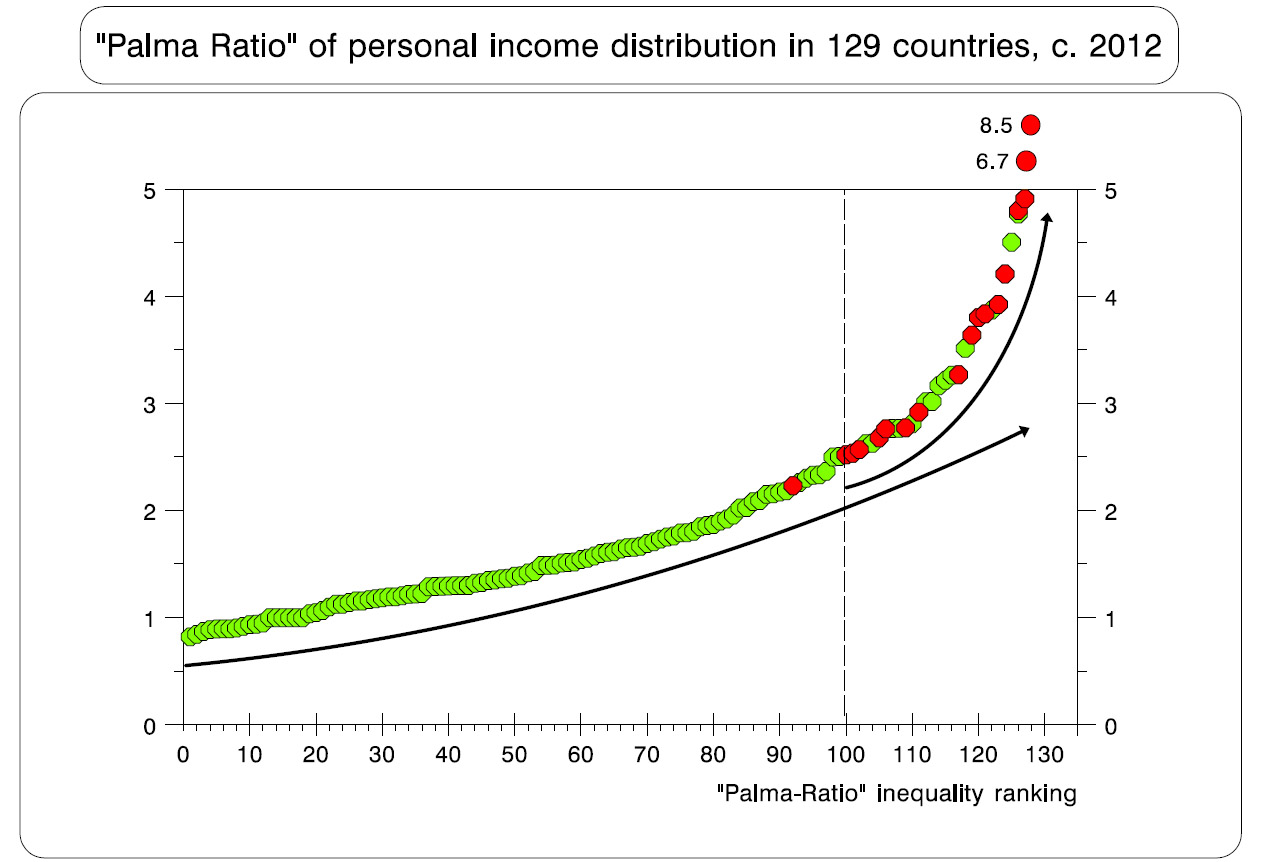
Source: Palma, 2016
Using the Palma index, the figure shows how inequality increases in an almost linear fashion quite steadily until about the 100th ranking, the point at which most Latin American countries come into the picture (as indicated by the red circles – with the exception of Uruguay), and where inequality starts increasing exponentially.
Moreover, we also need to reconsider the correlation between education and income distribution. Dr. Palma has noted that most of the diversity in educational attainment (especially in terms of tertiary education) across the world is found in the deciles 5 to 9 group. However, ‘why does one find extraordinary similarity across countries in the shares of national income appropriated by this educationally highly diverse group?’ (Palma, 2016). Chile is a case in point. With a rate of 71% of gross tertiary enrolment, the income share generated by deciles 7 to 9 in the country is about the same as that of the Central African Republic, which has a gross tertiary enrolment at only 3.1% (Palma, 2016). Hence, is it really all about education? Or is it that the positive externalities and effects of education will truly manifest themselves only in certain institutional settings? Ostensibly, more research has to be done to unravel the intricacies of the relationship between income disparity and educational attainment.
“We know very little.”
That was what Dr. Palma emphasised, during the lecture, to a sea of concerned faces amongst the audience. However, that is undoubtedly the right attitude to adopt as we challenge certain mainstream ideas in economics. Apart from being assiduous in the journey of constantly refining our tools of analysis, as demonstrated by the shift from the Gini index to the Palma ratio, we should also make a conscientious effort in reflecting about norms versus distortions. Indeed, from time to time, one must always make a critical assessment of the aspects on which one should focus.
References:
[1] Palma, J. G. (2016) ‘Do Nations just get the Inequality they Deserve? The ‘Palma Ratio’ Re-examined’, Cambridge Working Paper Economics, no. 1627, University of Cambridge.
[2] Palma, J. G. (2011) ‘Homogenous middles vs. heterogeneous tails, and the end of the ‘Inverted-U’: the share of the rich is what it’s all about’, Cambridge Working Paper Economics, no. 1111, University of Cambridge.
[3] Atkinson, A. B. (1970) ‘On the Measurement of Inequality’, Journal of Economic Theory 2. p.244-263.
[4] Cobham, A., and Sumner, A. (2013) ‘Is it all about the tails? The Palma Measure of Income Inequality’, CGD Working Papers, no. 343, Center for Global Development.
