Editor’s note: This post is part of a series showcasing BSE master projects. The project is a required component of all Master’s programs at the Barcelona School of Economics.
Introduction
Historically, there have been many strategies implemented to solve the portfolio choice problem. An accurate estimation of optimal portfolio allocation is challenging due to the non-deterministic complexities of financial markets. Due to this complexity, investors tend to resort to the mean-variance framework. If we consider the mean-variance framework, there are several drawbacks to this approach. The most pivotal one could be normality assumption on returns so that we could depict the behavior of returns only by mean and variance. However, it is well known that returns possess a heavy-tailed and skewed distribution, which results in underestimated risk or overestimated returns.
In this paper, we rely on a distribution of different metrics other than returns to optimize our portfolio. In simple terms, we combine several parametric and non-parametric bandit algorithms with our prior knowledge that we obtain from historical data. This framework gives us a decision function in which we can choose portfolios to include in our final portfolio. Once we have our candidate portfolio weights, we apply the first-order condition over portfolio variances to distribute our wealth between 2 candidate set of portfolio weights such that it minimizes the variance of the final portfolio.
Our results show that if contextual bandit algorithms applied to portfolio choice problem, given enough context information about the financial environment, they can consistently obtain higher Sharpe ratios compared to classical methodologies, which translates to a fully automated portfolio allocation framework.
Key results
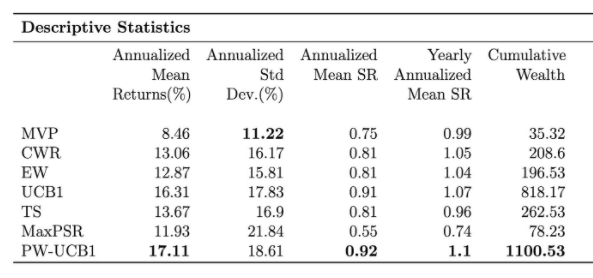
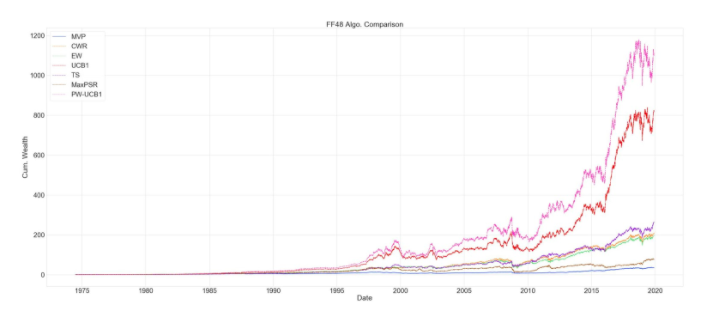
We conduct the experiments on 48 US value-weighted industry portfolios and consider the time range 1974-02 to 2019-12; The table below reports extensive evaluation criteria of following strategies by order; Minimum Variance Portfolio (MVP), Constant Weight Rebalance portfolio (CWR), Equal Weight portfolio (EW), Upper Confidence Bound 1 (UCB1), Thompson Sampling (TS), Maximum Probabilistic Sharpe ratio (MaxPSR), Probability Weighted UCB1 (PW-UCB1). Below the table, one can observe the evaluation of cumulative wealth through the whole investment period.

One thing to observe here, even UCB1 and PW-UCB yield the highest Sharpe ratios. They also have the highest standard deviation, which implies bandit portfolios tend to take more risk than methodologies that aim to minimize variance, but this was already expected due to the exploration component. Our purpose was to see if the bandit strategy can increase the return such that it offsets the increase in standard deviation. Thompson sampling yields a lower standard deviation because TS also consists of portfolio strategies that aim to minimize variance in its action set.

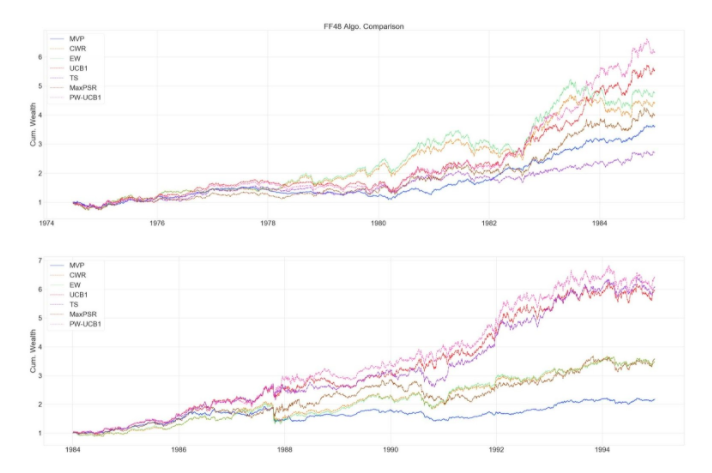
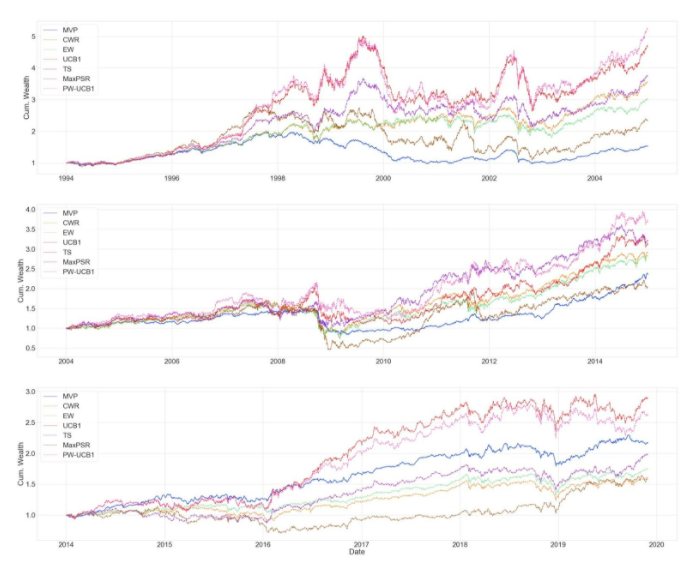
We also include the evaluation of cumulative wealth throughout the whole period and in 10 year time intervals. One interesting thing to notice is that bandit algorithms’ performance diminishes during periods of high momentum followed by turmoil. The drop in the bandit algorithms’ cumulative wealth is more severe compared to classic allocation strategies such as EW or MVP. Especially PW-UCB1, this also can be seen from standard deviation of the returns. This is due to using the rolling window to estimate moments of the return distribution. Since we are weighing UCB1 with the Sharpe ratio probability, and since this probability reflects the 120-day window, algorithm puts more weights on industries that gain more during high momentum periods, such as technology portfolio. During the dot.com bubble (1995-2002) period, UCB1 and PW-UCB1 gain a lot by putting more weight on technology portfolio, but they suffer the most, during the turmoil that followed high momentum period. One can solve this issue by using more sophisticated prediction model to estimate returns and the covariance matrix.


To conclude, our algorithm allows dynamic asset allocation with the relaxation of strict normality assumption on returns and incorporates Sharpe ratio probability to better evaluate performances. Our algorithm could appropriately balance the benefits and risks well and achieve higher returns by controlling risk when the market is stable.
