Industrial game over: can low-income countries grow through services rather than industry?

alumniMarco Antonielli ’12 (International Trade, Finance, and Development) is a consultant with Nathan Associates in London. Prior to this he was a consultant at the OECD in Paris and a research assistant at the Bruegel think tank in Brussels. The following piece by Marco originally appeared on Nathan’s website. (All opinion and analysis are only those of the author.)

Follow Marco on Twitter @AntonielliM and read his blog.


In a global economy with fewer opportunities to industrialize, low-income countries will need to embed the service sector in their vision for inclusive growth.

Amid a gloomy global economic outlook and crashing commodity prices, low-income countries ended 2015 with the slowest growth since 2009, and remain in serious need of new sources of inclusive growth. One major challenge to achieving higher living standards stems from the vast income and productivity gaps within these countries and in relation to the rest of the world.

Large-scale industrialization has traditionally been viewed as the main solution for bridging these gaps, as well as a strategic objective to create jobs and support future growth. Yet latecomers to development may have embarked on a path on which manufacturing—arguably the most promising sector—is expanding slowly in absolute terms, and often shrinking in relation to GDP. The questions are then: why do low-income countries struggle to industrialize? And could alternative sectors such as services replace manufacturing as engines of inclusive growth?

Growing out of the Traditional Economy

Let’s take a step back. While all economies are characterized by varying degrees of productivity and dynamism among sectors and businesses, the low-income countries feature tremendous structural gaps within their economies. Most of the workforce is employed in informal and traditional agricultural businesses, while manufacturing is limited and not fully organized and the dynamic services are largely confined to the cities. Also the modern and formal agricultural businesses are not as widespread as they could be.

To escape poverty, millions of workers need to move from low-productivity sectors and businesses, mainly agriculture, to high-productivity ones, where they will find better and more secure jobs. The reallocation of resources to modern and dynamic sectors can generate positive transformation and help low-income countries achieve inclusive growth.

However, economic transformation can lead to labor and capital being reallocated to more inefficient activities. Recent studies have found that from a macroeconomic perspective, structural transformation (i.e., intersectoral movement of resources) can be a drag on growth for long periods of time, and this is part of the reason why the growth dynamics of low- and middle-income countries have been so diverse. Such a pattern is illustrated in figure 1. Observing the breakdown (“decomposition”) of aggregate productivity growth in the sum of sectoral components and a component accounting for cross-sectoral labor reallocation, it can be noted that between the 1990s and the 2010s Asian and Eastern European countries benefited from the structural transformation of their economies, while Latin American and Sub-Saharan African countries had the opposite experience. Developing countries are therefore not necessarily transforming well over their growth paths.

Figure 1—Decomposition of aggregate productivity growth, 1990–2008
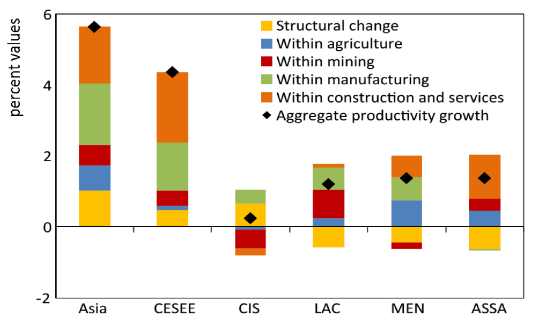
Figure 1

Source: Dabla-Norris et al. (2014)

CESEE: Central, Eastern and Southeastern Europe; CIS: Commonwealth of Independent States; LAC: Latin America and the Caribbean; MENA: Middle East and North Africa; SSA: Sub-Saharan Africa

Organized and modern manufacturing is commonly understood as the business where workers in informal or more traditional forms of agriculture should be reemployed. This is because, while manufacturing is not necessarily the most efficient sector in the economy, it can be a growth accelerator and engine of inclusive growth for at least three reasons. First, manufacturers in emerging economies can benefit from manufacturing technologies developed in more advanced countries, and can achieve fast productivity growth. Second, manufacturing can absorb unskilled labor—thus providing improved employment opportunities for agricultural workers in low-income countries. Finally, manufacturers can export their products, so their growth will not be confined by limited domestic demand. Tradability is key, because high productivity growth can quickly lead producers to lower their prices and shed labor and capital if they cannot scale up their sales in bigger markets.

Is Industrialization a Broken Engine?

Virtually all successful emerging economies in the past 30 years have industrialized by leveraging this potential. Manufacturing offers opportunities to diversify away from agricultural and other traditional products, and helps the country pull itself out of poverty. But is this growth trajectory still feasible for today’s developing countries?

In most countries, the share of jobs and GDP arising from manufacturing expands in the early stages of development, then peaks and starts shrinking as relative prices decline and the economy matures. As Dani Rodrik and others have recently argued, latecomers to development in Africa and Latin America are hitting the peak earlier in the process, and are starting to deindustrialize when manufacturing has exploited only part of its potential. Ghani and O’Connell, for example, explore this inverted-U relationship between the level of economic development and the industry’s share of total employment, in a panel of 100 countries. They show how, in recent times, jobs in industry have grown more slowly and shrunk earlier in the development process (figure 2). The engine of industrialization seems to be running out of steam.

According to Rodrik, this manufacturing decline is mainly due to the adverse effects of trade and globalization on low- and middle-income countries in Africa and Latin America in two respects. First, these countries struggle in the international goods market because of a decline in the relative price of manufacturing in advanced economies, where technological progress has pushed up efficiency and reduced the need for expensive labor. Second, low transport costs and low trade barriers expose them to hyper-cheap production from East Asia, effectively reducing the scope for “import substitution” to expand the boost in manufacturing exports to the wider economy. This would suggest that today’s low-income countries will need to wait until East Asia becomes expensive before they industrialize.

A competing theory is that the low-income countries have subscribed to a trade system that is altogether unfavorable to them. On the one hand, to get access to international markets they are required to forgo protectionist policies that foster import substitution and screen nascent industries from foreign competition during their early development (see e.g., Ha-Joon Chang). On the other hand, trade barriers to advanced markets like the EU are set low for raw materials such as coffee beans and cocoa pods but high for the products obtained from processing of materials—in these examples, roasted coffee and chocolate. This means that the entry points to industrialization of commodity-dependent countries are essentially shut down.

Figure 2—Is Industrialization Running out of Steam?

Figure 2

Source: Ghani and O’Connell (2014) with World Bank data

Help Services

Both theories offer plausible explanations of why low-income countries struggle to industrialize. While more evidence on the causes of the problem is needed, it is increasingly clear that vast-scale industrialization has not featured in the development of most low-income countries. In contrast, the service sector has grown rapidly and absorbed lots of labor. Looking at Sub-Saharan Africa, for example, in the 15 years of this century . This pattern does not adequately represent how low-income countries grow and expand their productive capabilities, at least in that it does not capture the role of the variety and complexity of the products menu offered by these countries. Yet it can raise the question of how services can replace manufacturing as an engine of inclusive development. At least three routes can be identified.

First, there is a fringe of dynamic and tradable services that can boost the economy just as manufacturing does. Banking, customer services, and communications are examples of services which the ICT revolution has opened up to trade, and which can take low-income countries on a growth escalator, as the Indian boom has demonstrated. Crucially, investments in infrastructure, education, and human capital need to be made to facilitate development in these services. An alternative service attracting foreign demand with decent labor-absorption capacity is tourism.

Second, services are crucial inputs to manufacturing and there is evidence that their importance is growing. Hence cheap and efficient services such as transport and telecommunications can translate into stronger competitiveness of the tradable sector—both manufacturing and services.

Finally, the fact that manufacturing and services are becoming increasingly “blurred,” with services activities making up a higher share of manufacturing output, means that low-income countries could exploit a competitive edge on relevant service tasks. Moreover, these tasks can often be unbundled from merchandise production and traded along the global value chain. Logistics, marketing and post-sales services have been on the rise, not only in developed economies but also in developing ones. Furthermore, this trend could lead to a misinterpretation of statistics based on obsolete sector categories, effectively misleading our understanding of structural change.

In sum, the service sector offers new and interesting opportunities for growth, both through tradable services that plug directly into the global economy and through services that support competitiveness of manufacturing. In a global economy with fewer opportunities to industrialize, low-income countries will need to embed the service sector in their vision of inclusive growth and focus on the conditions that enable these opportunities.

Many thanks to my colleagues Joe Holden and Ignacio Fiestas for their helpful comments. This blog first appeared at: http://www.nathaninc.com/news/industrial-game-over-can-low-income-countries-grow-through-services-rather-industry 

Can computers see?

Dario Garcia-Gasulla from the Barcelona Supercomputing Center introduced BGSE Data Science students to the Convolutional Neural Network (CNN) method of object recognition.

image recognition

Computers today have the ability to process information from images notably thanks to object recognition. This ability improved greatly over the past few years and reached human levels on complex tasks in 2015. The algorithm allowing them to do such thing is called Convolutional Neural Network (CNN). This method also enabled Google’s AI to beat one of the best GO players in the world and build self-driving cars.

This week, the Renyi Hour invited Dario Garcia-Gasulla from the Barcelona Supercomputing Center who introduced the Data Science students to this method.

You can find the presentation slides here:

[slideshare id=62763705&doc=deep-learning-bsc-garcia-gasulla-160606101501]


Repost from Barcelona GSE Data Scientists blog

Economic Effects of Catalan Independence: A Historical and Theoretical Perspective

ITFD students organized a talk on the economic effects of Catalan independence with Prof. Jaume Ventura.

By Ben Beuchel ’16, Frederik Møller Jensen ’16, and Saskia Mösle ’16, students in the International Trade, Finance, and Development master’s program


Why are so many Catalans advocating independence? What would be the economic consequences of a potential separation from Spain? To find answers, BGSE students from the Master’s Program International Trade, Finance, and Development organized a talk on the economic effects of Catalan independence with Prof. Jaume Ventura. Prof. Ventura is a senior researcher at the Centre de Recerca en Economia Internacional (CREI), research professor at Barcelona GSE and member of the Wilson Initiative, a pro-Catalan-independence association of academics in the fields of economics and political science.

What is the optimal size of a state?

From a theoretical viewpoint, the ‘right’ size of a state is determined by a trade-off between two opposing forces. On the one hand, economies of scale and the border effect (i.e. political borders hamper trade) create a force towards larger countries. Such benefits are especially pronounced in areas such as economic markets and defense. On the other hand, heterogeneity of people’s preferences with respect to culture, the legal system or welfare, embodies a force for smaller countries. According to Prof. Ventura, these two forces have shaped the size and structure of the state in two waves throughout the history of globalization.

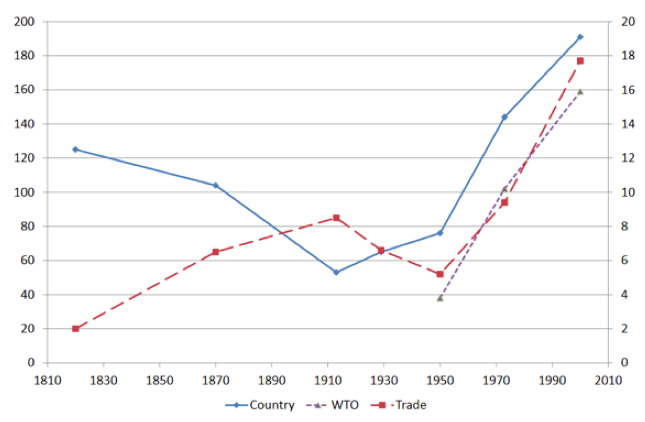
In the first wave, spanning from the Congress of Vienna to the beginning of the First World War, the number of countries more than halved, implying that states, on average, became larger. Political and economic integration proceeded hand in hand, and larger markets were created by sacrificing heterogeneity of preferences. After the Second World War, the second wave of globalization began. International trade reached higher levels and the number of countries multiplied to over 190. At the same time, international collaboration in the form of international organizations, such as the World Trade Organization, emerged. While this new era was characterized by political fragmentation regarding the nation state, larger markets were created through international cooperation and sacrificing economies of scope.

Figure 1
Figure 1. Trade share (right axis), the number of countries and WTO membership (left axis). Source: Gancia, Ponzetto, Ventura (2016).

The creation of supra-national organizations enabled countries to exploit economies of scale irrespective of their size. As supra-national entities took over functions such as defense, which had previously mandated a larger state, even small states were able to thrive. At the same time, competencies such as culture, law and order and the welfare state remained on national agendas, as cultural globalization proceeds more slowly than economic globalization. All in all, it seems that the homogeneity of constituents’ preferences has become a more decisive determinant of a country’s size in the second wave of globalization.

The Catalan perspective

With this theoretical background in mind, Prof. Ventura turned to the specific case of Catalonia. First, he argued that small states in Europe, such as Norway and Switzerland, are competitive and wealthy. A potential Catalonian state with 7.5 million inhabitants would be larger than Denmark, Norway and Ireland, and only slightly smaller than Switzerland. Studies also find that the effect of size on economic growth depends on the degree of openness (Alesina, Spolaore and Wacziarg 2005). If a country is very open, size seems to have negative effects on growth. Catalonia, with a high degree of openness of 130%, could thus potentially grow faster if independent from Spain.

Next, Prof. Ventura focused on the long-run economic benefits of independence. If Catalonia became independent, this would imply giving up economies of scale arising from the union with Spain. However, these costs remain limited, in his opinion. The fixed costs of running a Catalan state have been generously estimated to be €2.793m which represents 1.4% of Catalan GDP, or €383 per Catalan citizen. Additionally, markets and defense have already been outsourced to the EU and NATO, suggesting that Catalonia would not lose out if it gave up the union with Spain (provided that it remained a member of EU and NATO). A major benefit for the Catalan economy would be the stop of fiscal transfers to the rest of Spain. Currently, taxes paid to the central government exceed public spending in Catalonia by €16.409m (8.4% of GDP). Moreover, current public capital in the region is the lowest throughout Spain. Public investment in Catalonia accounted for merely 8-9% of Spanish public spending, even though Catalonia contributes roughly 20% to the Spanish GDP.

In the short-run, there is a chance that costs might arise from retaliation by the Spanish state, and maybe others. However, Prof. Ventura estimates such costs, e.g. commercial boycotts, to be small and short-lived. He argues that retaliation would not be a sub-game perfect outcome, as most of the EU’s foreign investments and trade with Spain flows through Catalonia.

While the potential economic gains are substantial, Prof. Ventura emphasized that the heterogeneity of preferences between Catalonia and the rest of Spain remains the key reason behind Catalonia’s longing for independence. He pointed to his experience in the U.S., where the states enjoy a high degree of autonomy regarding education, justice, infrastructure, welfare and culture. In contrast, Spain’s central government dominates most aspects of public policy and previous attempts to increase Catalonia’s autonomy within Spain have failed.

While the future of Catalonia remains uncertain, Prof. Ventura advocated the right to self-determination and believes that “Catalan independence offers a unique window of opportunity to reform a bankrupt state and adapt it to modern times, both in Catalonia and Spain”.

References

  1. Gancia, G. A., Ponzetto, G. A., & Ventura, J. (2016). Globalization and Political Structure. NBER Working Paper No. 22046.
  2. Alesina, A., Spolaore, E., & Wacziarg, R. (2005). Trade, Growth and the Size of Countries. Handbook of Economic Growth, 1499-1542.

Atif Mian on household debt, economic growth, and global externalities

Evan Seyfried ’16 (Economics of Public Policy) summarizes the lecture by Princeton’s Atif Mian.

authorEvan Seyfried ’16 shares the following summary of a talk given by Princeton’s Atif Mian this May to the UPF Department of Economics and Business. Follow Evan on Twitter @evanseyf


The bubble

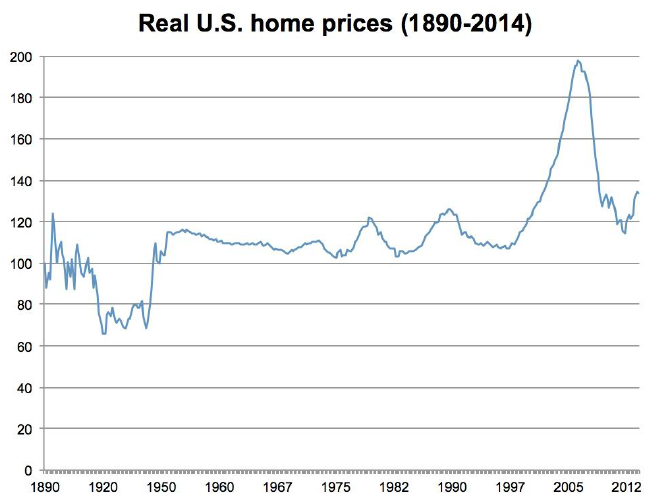
In 2006, house prices in the U.S. reached their all-time peak. The S&P/Case-Shiller Housing Price Index had doubled in just eight years (not accounting for inflation).1 The year before, Robert Shiller (whose work on historical housing prices led to the creation of the Case-Shiller Index) had published an update to his book Irrational Exuberance warning that recent growth in housing prices was historically unprecedented—he argued that houses were wildly overpriced and would likely revert back to a relatively constant historical value in the long run.2 His research showed that if you looked at real prices (inflation-adjusted) in the U.S. housing market prior to the early 2000s bubble, you would find that prices have not changed much since 1890!

Figure 1
Figure 1. Case-Shiller Home Price Index from 1890-2014. Values are real (corrected for inflation) and are set relative to 1890 prices (which is defined as 100). Source: Data from Robert Shiller, graph from The Atlantic3

The frenzy of the early 2000s finally caught up with lenders, homeowners, and investors, who began to doubt the continued rise of house prices. In late 2005, with interest rates rising, a growing number of homeowners with Adjustable-Rate Mortgages (ARM) began to default on their mortgages. Finally, by the end of 2006 the housing bubble began to collapse under its own weight, and the shockwaves ripped through the financial sector—which had bet heavily on the U.S. housing market through mortgage-backed securities and newer exotic financial instruments. French bank BNP Paribas, on August 7, 2007, famously suspended withdrawals from its investment funds associated with subprime mortgages, a move that triggered a shadow banking run, and is often considered the official start of the financial crisis—when the housing market instability truly began to upend the financial sector. What followed was the most severe financial crisis since the Great Depression and a long recession for the rest of the U.S. economy.

But there is still much to be learned about the interaction of the housing bust (leaving many homeowners with very high debt compared to their assets), the crisis in the financial sector (wherein banks have been generally unwilling to either extend new credit or restructure existing loans), and the continuing economic malaise in the U.S. and other economies around the world.

From the housing bubble to household debt

A great deal of Princeton economist Atif Mian’s research—much of it in collaboration with University of Chicago economist Amir Sufi—has studied these interactions, exploring the fallout from the housing bubble in the U.S. and the subsequent “debt overhang.”

What is household debt overhang?

Imagine a family owes $200,000 on their mortgage. If the market crashes and the house value suddenly declines to $180,000, then the family now owes $20,000 more than the value of their house. Thus, even if the family chooses to sell the house, they will not be able to pay back the mortgage in full. This is also called being “underwater” on a mortgage. In the context of all household finances, debt overhang is a similar concept to being underwater, and refers to the amount of indebtedness of a family beyond the value of their assets, taking into account their anticipated income. Debt overhang makes a household unattractive to lenders (both for new loans and for refinancing old loans), because they do not have any collateral that is not already used to cover existing debt.

Note that household debt is treated separately from other private sector debt (mainly non-financial firm debt), and shows notably different dynamics. All of Atif Mian’s research mentioned here focuses specifically on household debt.

In 2013, Mian published evidence that poorer families who were highly leveraged in the housing market reacted very sharply to the loss of wealth when their homes depreciated following the housing bust. Because their marginal propensity to consume out of housing wealth (how much families spend knowing that they have a certain amount of wealth in their house to fall back on) is higher than for middle- or upper-income families, their consumption dropped disproportionately in the years after the bubble.4 Of course, at the individual level this behavior is rational, but at the national level low consumption growth in a demand-constrained economy has created a negative feedback loop of lower job growth, lower income growth, and a further drop in consumption growth.

One of the takeaways from this body of research is that governments and international finance organizations need to do a better job of properly accounting for how private sector debt affects consumption. Optimistic forecasts for recovery from the 2008-2010 Great Recession did not sufficiently account for depressed demand as homeowners and those with credit card and student debt eschewed consumption to deleverage themselves. In a comment on Karen Dynan’s research on household debt overhang and consumption, Mian wrote: “… macroeconomic policy in a world where consumption is driven by debt overhang needs to be seen through its implications for the net worth of the borrowing households.”5

Imperfect instruments?

But Mian also wanted to take these insights from the Great Recession and ask more fundamental questions about private debt and predictions of economic growth: Was consumption affected similarly affected during other periods of high household debt? Do we see similar household debt effects in other countries? If so, how does this extra drag on consumption affect how economists forecast economic growth?

Mian recently gave a lecture at the Universitat Pompeu Fabra in Barcelona, presenting the findings from his attempt to answer those questions. (The working paper, coauthored with Amir Sufi and Emil Verner, is available from the National Bureau of Economic Research.6 ) They took a sample of 30 countries (mostly advanced economies) and compiled private debt data back to 1960. Then they identified shocks to household credit and looked at the relationship between those shocks and subsequent GDP growth. (In this context, shocks should be thought of as sudden increases in the availability of credit.)

Initially they found that high growth in household credit was predictive of subsequent low GDP growth. But they needed to identify the nature of those credit shocks to find possible causal channels. According to Mian they wanted to “rule out demand-driven shocks.” Demand-driven shocks come from the consumer side and could be an increase in the use of credit to smooth lifetime consumption, or as an “insurance effect” to get liquidity today due to uncertainty or an expectation of economic shocks tomorrow. On the other hand, a supply-driven credit shock would be banks extending more and more credit due to government policy changes or financial innovation.

The first demand-driven possibility is relatively simple to disprove. Because the Permanent Income Hypothesis suggests that households borrow today in the expectation of higher future income, the fact that household debt increases should be indicative of economic growth. As mentioned before, Mian, Sufi, and Verner find the exact opposite relationship. The second demand-driven possibility is unlikely because much of the growth in household debt across all the countries in the survey is in mortgage debt, which is generally not taken on to provide liquidity.

Next, they looked into the supply-driven credit shock mechanism and tried to find a way to overcome the presumably endogenous relationship between credit supply shocks and subsequent lower GDP growth. The mechanism must explain why people borrow in the first place, especially what causes them to over-borrow (what Mian calls an “aggregate demand externality”—an effect that spills over to other borrowers), and explain why excessive borrowing actually leads to a decline in real output (what Mian calls “macro frictions” that generate the slowdown, such as monetary policy and “wage rigidity”). As the authors write in the paper: “The key ingredient in this model is an aggregate demand externality that is not properly internalized by borrowing households at the time they make their borrowing decision.”

Two problems remained. First, the authors had to come up with a measure of “credit supply shocks” that could apply to dozens of different countries. Second, they had to choose a measure that could help identify the causal relationship, not just the correlation. Their solution was to use one measure for the U.S. (share of debt issuance by risky firms) and a simpler one for non-U.S. economies (the spread of sovereign debt yields compared to equivalent U.S. Treasury notes). According to Mian, these are “not instruments in the usual sense of the word” (which must satisfy the requirements of independence from the outcome variable and relevance to the explanatory variable). Rather, they are “imperfect instruments” (see Nevo and Rosen, 2012.7 for more information) and, per Mian, “as long as we can sign the covariance of the instrument, we can partially identify the range in which the coefficient lies.” In other words, because these proxies for credit supply shocks typically signify expectations of good times, then if we see that they actually predict bad times, we can at least identify a range of values for how strong the link is between an increase in household debt and subsequent low growth.

The methodology is admittedly complex, and audience members had some reservations about how the authors had dealt with household debt (particularly since household debt is mostly mortgage debt). One audience member suggested that housing bubbles could be the main driver of subsequent low growth, with the extension of credit simply a side effect. Mian acknowledged that he cannot outright reject this concern, but added that the results are robust to controls for house prices, so the bubbles should be controlled for. Another audience member suggested that this could be tested for if the data set included any countries which had seen a credit boom with no attendant housing bubble. There are, in fact, some countries in the data set, but, as Mian stressed, there was not enough of a subsample for a strong statistical test of this hypothesis.

Onward to global growth!

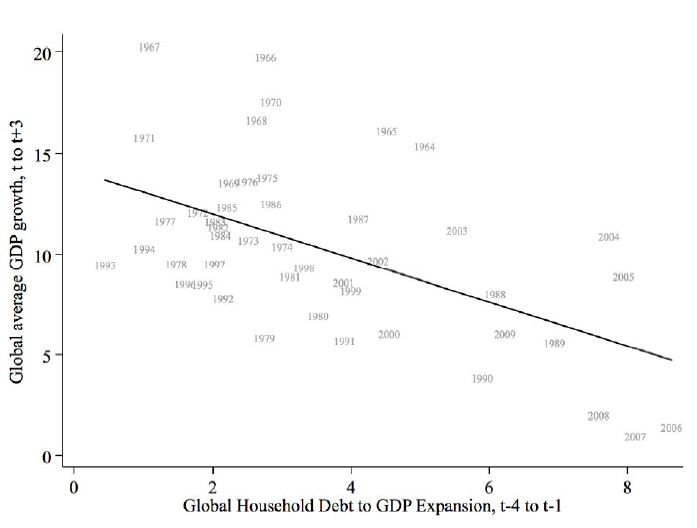
After presenting the “within country” results—showing that household credit supply shocks tended to lead to lower growth in the five or so years following—Mian pivoted to the global portion of the paper. The goal here was to establish the spillover effects of these credit supply shocks among different countries. Sure enough, Mian stated that “the global cycle is more destructive” due to financial spillovers between countries. Because the growth slowdown in a given country after the credit shock leads to a reduction in imports, the problem is transferred to that country’s trading partners. Furthermore, the effects are exacerbated by “macro frictions,” especially in countries that employ fixed exchange rate regimes, borrow primarily in foreign currency, and are near the zero interest rate lower bound (although recently the zero interest rate bound has been proving not to be much of a hard bound after all). Figure 2 shows these global aggregate effects.

figure
Figure 2. Aggregated global growth vs. aggregated growth in household debt-to-GDP ratio. Source: Mian, Sufi, and Verner (2015)6

Mian stressed that these dynamics between debt and growth, especially the global ones, should be seen as relatively recent (“last-forty-years effects”) side effects of globalization and the financialization of household debt. He concluded that governments must respond to these powerful forces with targeted macroprudential policies, and forecasters at organizations like the IMF and OECD must learn to better account for household debt in their growth projections.

References

  1. S&P Dow Jones Indices LLC. S&P/Case-Shiller U.S. National Home Price Index [CSUSHPINSA]. FRED, Federal Reserve Bank of St. Louis.
  2. Shiller, Robert J. 2005. Irrational exuberance. Princeton, N.J.: Princeton University Press.
  3. Thomspon, D. 2014. “How Did Canada’s Middle Class Get So Rich?” The Atlantic. April 22, 2014.
  4. Mian, Atif R. and Rao, Kamalesh and Sufi, Amir. 2013. “Household Balance Sheets, Consumption, and the Economic Slump.” Chicago Booth Research Papers. No. 13-42; Fama-Miller Working Paper.
  5. Dynan, K. 2012. “Is Household Debt Overhang Holding Back Consumption?” Brookings Papers on Economic Activity. Spring 2012.
  6. Mian, A., Sufi, A., and Verner, E. 2015. “Household Debt and Business Cycles Worldwide.” NBER Working Papers. Working Paper No. 21581.
  7. Nevo, A., and Rosen, A. 2012. “Inference with imperfect instrumental variables.” Review of Economics and Statistics.

Defining data for decision-making

authorBy Benjamin Anderson ’15 (Master’s in Economics of Public Policy).

Ben is a Data Strategist for Made in Durham, a non-profit organization in North Carolina (United States) that works to improve education and career outcomes for local youths.

This article originally appeared on Made in Durham’s website.


In the past few weeks, there have been a barrage of media reports about educational achievement and, more generally, life outcomes for the youth of Durham.

The positive news is that these issues are receiving attention, but the downside is that the reports may be more harmful than helpful. At its best, data optimizes decision-making, but at its worst data can be deceptive and divisive.

Specialized knowledge is required to leverage data for decision-making, whereas selectively reporting figures requires some effort but no expertise. In the latter scenario, the ambiguity of statistical assumptions predisposes the audience to personal, as well as, framing bias. Those who go through the effort to produce data often have an agenda, and therefore, have incentives to make claims which imply causes and solutions. Data is dangerous when misused. It can create tension, undermine trust and unity, and result in costly adverse decision-making.

One key characteristic of amateur statistics, aside from lacking an experimental design, is that they do not account for the fact that outcomes are a function of many different variables. For example, schools clearly play a crucial role in influencing academic attainment, but a report drawing relative comparisons between attainment outcomes within or across cities usually implicates unidentified failures of one school district versus another while all but ignoring the effects of transportation, affordable housing, food, healthcare, and social support accessibility, as well as people’s different lived experiences, including traumatic exposure of various kinds.

Reactivity to outcomes is strongly linked to bias and emotion. Making decisions about problems and solutions based exclusively on outcomes is the logical equivalent to going with your gut.

Descriptive statistics alone have a tendency to reinforce what we already think we know rather than helping us to gain an objective understanding of the issues because we often overestimate our understanding of the context. Shards of truth may be buried in our presumptions or between the different storylines, but other times the truth isn’t within sight.

If one wanted to know what public schools are doing right and what positive changes could be made, the reported outcomes would not meaningfully increase understanding. This would be like a college basketball coach using the Ratings Percentage Index (RPI) to make game plans. The RPI is simply a function of outcome variables that are influenced by other, more influential variables over a team’s success, such as shot selection, rebounding, ball control and many others.

Similarly, objective inference about the determinants of academic achievement are impossible when we simply have some measure of the output, like grade level proficiency, graduation rates or achievement gaps. Summarized outcomes do not even begin to untangle the multifaceted causal factors of student achievement, or even point to which factors are within the schools’ control and which are shaped by other institutions that govern infrastructure, real estate development, credit markets and criminal justice.

Good intentions often lead to unintended consequences. Calculating outcomes or deriving slightly new definitions of them does not enhance the cultural or intellectual competence of our community, its citizens or the institutions within it.

This is troubling because the extent of harm done with every report that subjectively frames and selectively reports data will never be known. A symptomatic obsession can enable data to have a negative social impact, leading to the proliferation of economic and racial segregation, adverse selection of people and funds from public schools, victim blaming and the marginalization of objectivity. The focus needs to shift from symptoms to solutions.

Data should be collected and analyzed in a way that enables us to separately identify effects on outcomes, including those determinants within the school’s control and those outside, so that all can be addressed in order of impact and feasibility. Robust evaluations should yield insight, pointing out specific causal factors that affect outcomes that the schools, nonprofits policy and citizens can address.

Applying a scientific lens to social issues transforms data from punitive to instructive. Careful investigation using valid quantitative methods can help us gain an understanding of the inferences that the data will and will not permit. Through empirical analysis, we have the opportunity to disentangle the effects that different factors have on certain outcomes. This is powerful because it enables us to create informed strategies.

Subsequently, when we know how our potential actions will affect an outcome, a cost-benefit analysis can help decide which evidence should be brought to action. Operating in the public and nonprofit sectors, the cost-benefit analysis goes beyond fiscal considerations to examine social returns. Combining these empirical tools puts us in a position to optimize social welfare. Data or analysis vacant of these characteristics will result in suboptimal decision-making.

An empirical basis for decision-making that respects the complexity of determinants on outcomes and the tradeoffs between various actions or lack of action should be utilized at all levels – from the systemic to the programmatic. A symptomatic focus and a preoccupation with a single area will not result in systemic improvement. As institutions, organizations and programs, our goal should be to improve, which can only be achieved through learning.

Durham has great potential to grow while enhancing the well-being of all, including the most marginalized. Continuous improvement requires the commitment of people in the public, private, and social sectors to work together.

Part of analytical integrity is the acknowledgement that sometimes our data tells us nothing at all. If we truly care about addressing systemic issues, lack of information is a strong argument for why we should build more robust datasets that incorporate variables across institutions and the socio-economic environment. This requires a willingness to coordinate and to learn. Importantly, these actions imply the willingness to change.

The Made in Durham partnership exists to address issues of the highest importance. It is the job of data is to increase the role of evidence in the partnership’s decision-making, and because of the gravity of these decisions, I also feel an ethical accountability to this work.

If we aren’t asking the right questions, data can lead to costly decisions that undermine improvement. As members of the community, we should all be able to ask the right questions to hold decision-makers accountable to analytical standards that drive improvement.

Regardless of what the outcomes show now, or anytime in the future, what we should be asking is: what are the causes of these outcomes, what are their magnitudes, and thus, what can we do to improve.

Special talk for master’s students by Justin Yifu Lin on “New Structural Economics”

authorLecture summary by Tuomas Kari ’16 (Master’s in International Trade, Finance, and Development)


The former Chief Economist of the World Bank and member of Barcelona GSE Scientific Council Justin Yifu Lin visited Barcelona GSE on May 2nd to give a special talk to the Master students on a new approach to development policy, titled “New Structural Economics: The Third Wave of Development Thinking”. Professor Lin, who currently teaches at the National School of Development at the University of Beijing, outlined the history of development economics and its shortcomings. The goal of the lecture was to derive lessons for optimal policy and then expand upon the idea of new structural economics, the approach Prof. Lin himself advocates.

Structuralism and neoliberalism

Prof. Lin divided the history of development into two time periods: structuralism that was dominant from 1950 to the 1980s, and neoliberalism that has been the main viewpoint up to this day. Structuralism tended to assume that there were market failures that needed to be corrected with industrial policy, such as import substitution. The failure of these policies is well documented as the government-subsidized industries rarely survived at global markets and distorted the countries’ economies. Neoliberalist reaction emphasized deregulation to rid the economy of rent seeking and liberalization to let markets determine the allocation of resources. But this too failed in developing countries to reach steady growth. Often, liberalization led to the collapse of entire sectors, high unemployment and subsequent political unrest.

The main exception to these consensus policies throughout the last half a century have been the East Asian Tigers, Hong Kong, Singapore, South Korea and Taiwan, countries that followed a dual track of capitalist and state-directed policies and achieved unmatched growth rates. As these countries were initially too poor to afford expensive subsidies to heavy industry, they promoted production lower in the value chain, and even then only by piece-meal measures. According to Prof. Lin, this lack of better options guided the Tigers to good policies by accident.

photo
Professor Lin delivered the Barcelona GSE Lecture at Banc Sabadell later the same day to the entire BGSE community.

Economic growth as a result of structural transformation

New structural economics is an attempt to study the determinants of economic structure and its evolution using neoclassical methods. Prof. Lin starts from the hypothesis that economic structure is endogenous to the country’s endowments and optimal policy guides the economy to activities where it enjoys comparative advantage. If a country attempts to transform its economy to activities other than those that utilize its endowments, this will only result in distortions, breaking down of market mechanisms and rent seeking. Optimal policy must start from the development of endowments (capital stock, human capital etc.) and only after try to deal with the production structure. As economic growth is ultimately a result of structural transformation, Prof. Lin argued that governments must engage in first building up the necessary endowments and then using industrial policy to help firms enter into business.

The preconditions for economic growth are having a functioning market economy efficiently allocate resources across sectors and firms, and a facilitating state that provides transitional support for firms entering and exiting the market and liberalizing the economy gradually using discretion. Lin claimed would lead to competitiveness, openness to trade, and strong fiscal and external accounts, which allow the economy to avoid crises and engage in countercyclical policies. Another benefit would be high returns to investment that provide incentives to save.

Room for more economic research

Prof. Lin promoted the setting up of Special Economic Zones to allow firms to do business free from distortions and also work as laboratories for the government to see what the comparative advantages of the economy are. He ended the lecture by proposing the development of theoretical models capable of explaining these dynamics as a fruitful avenue for the future economists in the audience.

Bayesian statistics applications in Physics

Data Science students had a talk with Johannes Bergstron, a Postdoctoral researcher at Universitat de Barcelona, about physics and the implications of Bayesian statistics for the field.

From the Barcelona GSE Data Science student blog:

bergström

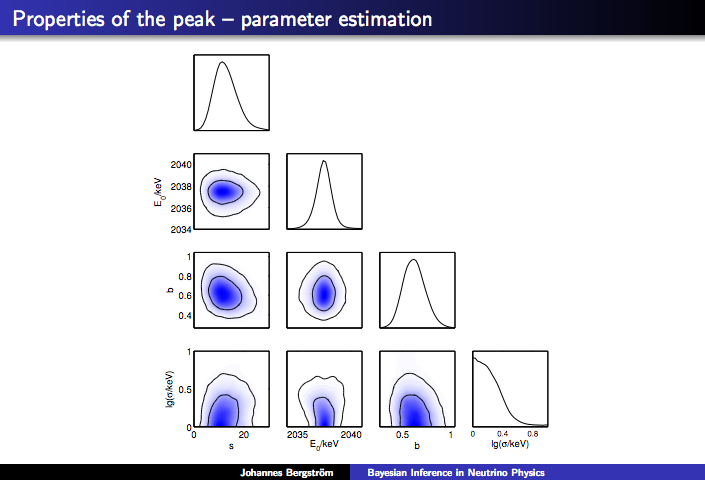
Data Science students had a talk with Johannes Bergstron, a Postdoctoral researcher at Universitat de Barcelona, about physics and the implications of Bayesian statistics for the field. Read about the Renyi Hour talk and view the presentation slides on the BGSE Data Scientists blog.

34th Barcelona GSE Lecture: Robert Lucas

Evan Seyfried ’16 (Economics of Public Policy) recaps the Barcelona GSE Lecture by Robert E. Lucas (Chicago, Nobel Laureate)

Barcelona GSE Lecture

Lecture summary by Evan Seyfried ’16 (Master’s in Economics of Public Policy). Above, the author talks with Robert Lucas after the lecture.


The modish Banco Sabadell Lecture Hall, overlooking grand, prosperous Avinguda Diagonal, is filled to capacity this Thursday evening. Nobel laureate economist Robert Lucas is here to present the 34th Barcelona GSE Lecture, and the GSE community is eagerly anticipating the talk.

“What was the Industrial Revolution?”

The topic would have seemed almost trite in less-skilled hands. Lucas, however, over the past decade has focused his talents on exploring economic models that might explain rapid industrialization like that of the United Kingdom starting in the late 18th century. He views the rise of urbanization and industrialization through the lens of economist Gary Becker’s theory of population fertility and couples it with a human capital growth model.

This talk draws heavily from Lucas’s recent research on human capital and economic growth1, the diffusion of the Industrial Revolution2, and a rejection of the “great men” hypothesis of economic progress3.

The central hypothesis of his lecture tonight is, essentially, that of his 2015 paper on economic growth, with its blissfully short abstract:

“This paper describes a growth model with the property that human capital accumulation can account for all observed growth. The model is shown to be consistent with evidence on individual productivities as measured by census earnings data. The central hypothesis is that we learn more when we interact with more productive people.”1

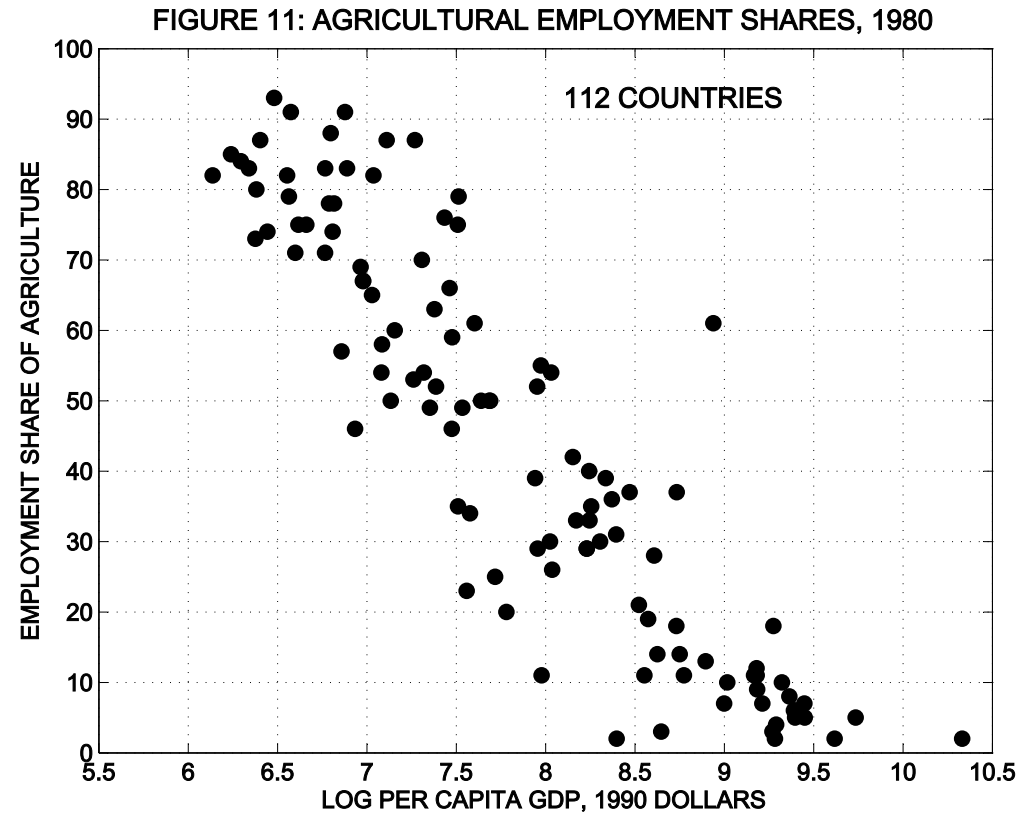
From this basis, Professor Lucas presents his most recent work on the topic. He begins with a graph—how else would an economist begin any lecture?—showing the striking relationship between a country’s prosperity (measured in GDP per capita) and the share of its population employed in agriculture.

chart
Graph depicting the relationship between agricultural intensity (“employment share of agriculture”) and national wealth (“log GDP per capita”). Source: Lucas (2009)2

Why is the relationship between these two variables so consistent? Later in the lecture, Lucas will develop his model based on a “dual economy” of low-skilled agricultural workers and various levels of skilled urban dwellers.

But first, a little history.

“Macroeconomics’ finest hour.” (A brief historical digression.)

Thomas Robert Malthus, English cleric and scholar, became famous (and, to some, infamous) when he published “An Essay on the Principle of Population” in 1798. The essay neatly distilled a framework for pre-industrial population dynamics:

“Yet in all societies, even those that are most vicious, the tendency to a virtuous attachment is so strong that there is a constant effort towards an increase of population. This constant effort as constantly tends to subject the lower classes of the society to distress and to prevent any great permanent amelioration of their condition.”4

Its publication led to a massive controversy that rapidly spread across the landscape of political economy. Although Malthus’s work was not nearly as apocalyptic as his deriders asserted, it still pointed out uncomfortable truths about the seemingly unrelenting misery of the lower classes, even in “advancing” nations.

A century and a half later, economist Gary Becker took up the Malthusian mantle with his seminal work, “An Economic Analysis of Fertility,” a study of the dynamics of family planning and income. Becker explicitly acknowledged his debt to Malthus: “[…] Malthus’ famous discussion was built upon a strongly economic framework; mine can be viewed as a generalization and development of his.”5 Becker’s further research concluded that viewing fertility as a result of marginal-cost/marginal-benefit decisions is a satisfying way to explain the phenomenon of high-income families voluntarily lowering their fertility rates. His framework implies that families with more human capital invest more resources in fewer children.

Professor Lucas calls the Malthusian insight and the subsequent robust debate among political economists of the day “macroeconomics’ finest hour.”

The Path Off the Farm: What Is an Industrial Revolution?

Lucas now presents his synthesis: Becker’s fertility model combined with Lucas’s own human capital model, both placed in the context of the urban-agricultural dual economy.

Like Becker, Lucas’s model has parents view their children as “durable goods” that yield a “psychic utility” but also impose costs. As families move up the socioeconomic ladder, they make different decisions regarding investment in the “quality” of the children (everything from time spent teaching, to money invested in tutors and private schools). Over time, the quantity/quality balance leads to lowering fertility among higher socioeconomic classes.

In the dual-economy framework, rural (landless or small proprietor) farmers are pushed by wage considerations to move into dynamic urban environments as low-skilled workers. At first, with no wealth to invest in their children, they make “quantity” a priority over “quality.” Over generations, however, there is a tipping point where a given family has accumulated enough resources to make meaningful human-capital investments in their children. Once this occurs, they can now move up to the higher-skilled tiers of society. Crucially, it is this accumulation, not of wealth, but of human capital, that drives further growth in Lucas’s model. The speed at which these changes occur depends on the magnitude of “interactions” in society: how often and to what degree people engage with one another in productive exchanges—anything from academic discussions to business deals.

A key mechanism in the model is that economic growth itself is what allows the low-skilled workers, coming from the farms, to dependably get better and better jobs over time. Thus, the dynamic is self-reinforcing as more rural workers move to the cities.

When considering the Industrial Revolution, we can appreciate how natural it would be to dismiss the intangible, fuzzy concept of “human capital” and only focus on material capital: factories, infrastructure, mines, etc. But if we view the Industrial Revolution with Lucas’s model in mind, we can at the very least see that Lucas’s statement from his 2015 paper—”human capital accumulation can account for all observed growth”1—is quite plausible.

Later in the same paper, Lucas asserts: “The contribution of human capital accumulation to economic growth deserves a production function of its own.” 1 In the model Lucas has presented tonight, he answers his own demand. There is, indeed, a “production function” for human capital, and when it is coupled to a fertility model, it can show the dynamics of rapid urbanization and economic growth. In other words, it can model an industrial revolution.

To use Lucas’s own words from the lecture: “We used to think of the Industrial Revolution as factories and coal, but I think the main consequence was the emergence of the bourgeoisie who are just creating things out of nothing, generating wealth and production.”

Postscript

What does this all mean? What are the implications of this model in 2016?

We go back to the graph showing the relation between GDP per capita and share of population in agricultural work. Lucas mentions how many areas of the world are still in the upper left portion of the graph—poor, agricultural, unskilled-labor-intensive economies. According to Lucas, we must not be deluded into thinking that a pastoral lifestyle is something to be preserved at the cost of indefinite poverty. Lucas states, “The idea that you can prettify this lifestyle is just plain wrong.” Rather, we have a collective interest in the flourishing of all people around the world, and we have emerging evidence that investment in human capital, coupled with smart urbanization, is one of the best ways to achieve it.

The questions following the lecture are—as expected from economists—pointed. In response to questions about the refugee and economic migrant crisis in the EU, Lucas denies that his model says anything specific about it, but states emphatically that he supports immigration in general. Finally, when asked about the prospects of continued economic growth, given recent anxiety about economic stagnation, Lucas responds that since the Industrial Revolution we have seen stable growth unlike any period before in recorded history. He believes that growth will continue, as capitalism reinvents itself yet again, this time for the information age—though he admits that “flush toilets are way more important than Facebook.”

With that, the lecture concludes, and the lucky attendees weigh the expected utility of waiting in line to speak with the most influential living economist against the expected utility of beating the rush to the cava and jamón ibérico at the reception. The gears of the market keep turning.

References:

  1. Lucas, Robert E. 2015. “Human Capital and Growth.” American Economic Review, 105(5): 85-88.
  2. Lucas, Robert E. 2009. “Trade and the Diffusion of the Industrial Revolution.” American Economic Journal: Macroeconomics, 1(1): 1-25.
  3. Lucas, Robert E. 2009. “Ideas and Growth.” Economica, Vol. 76, Issue 301: 1-19.
  4. Malthus, Thomas Robert. 1798. “An Essay on the Principle of Population.” Library of Economics and Liberty.
  5. Becker, Gary S. 1960. “An Economic Analysis of Fertility.” Demographic and Economic Change in Developed Countries. Princeton: Princeton University Press.

Mind the (Gender) Gap

Post by Ana María Costa-Ramón ’14, Dimitria Gavalyugova ’14 and Ana Rodríguez-González ’14, alumni from the master’s in Economics at the Barcelona GSE

The gender gap is not unique. Or, at least, it is far from being a unidimensional concept. Rather, a vast literature demonstrates that it is multifaceted: we find gender gaps in education, the labor market, intrahousehold organization and politics, to say a few (Casarico and Profeta, 2015), and all of these are likely to be profoundly linked to one another. As Claudia Goldin points out, “these economic gender gaps have been a major issue in the women’s movement and a major issue for economists”. Here we mainly focus on just one of these dimensions – though complex enough: the gender pay gap.

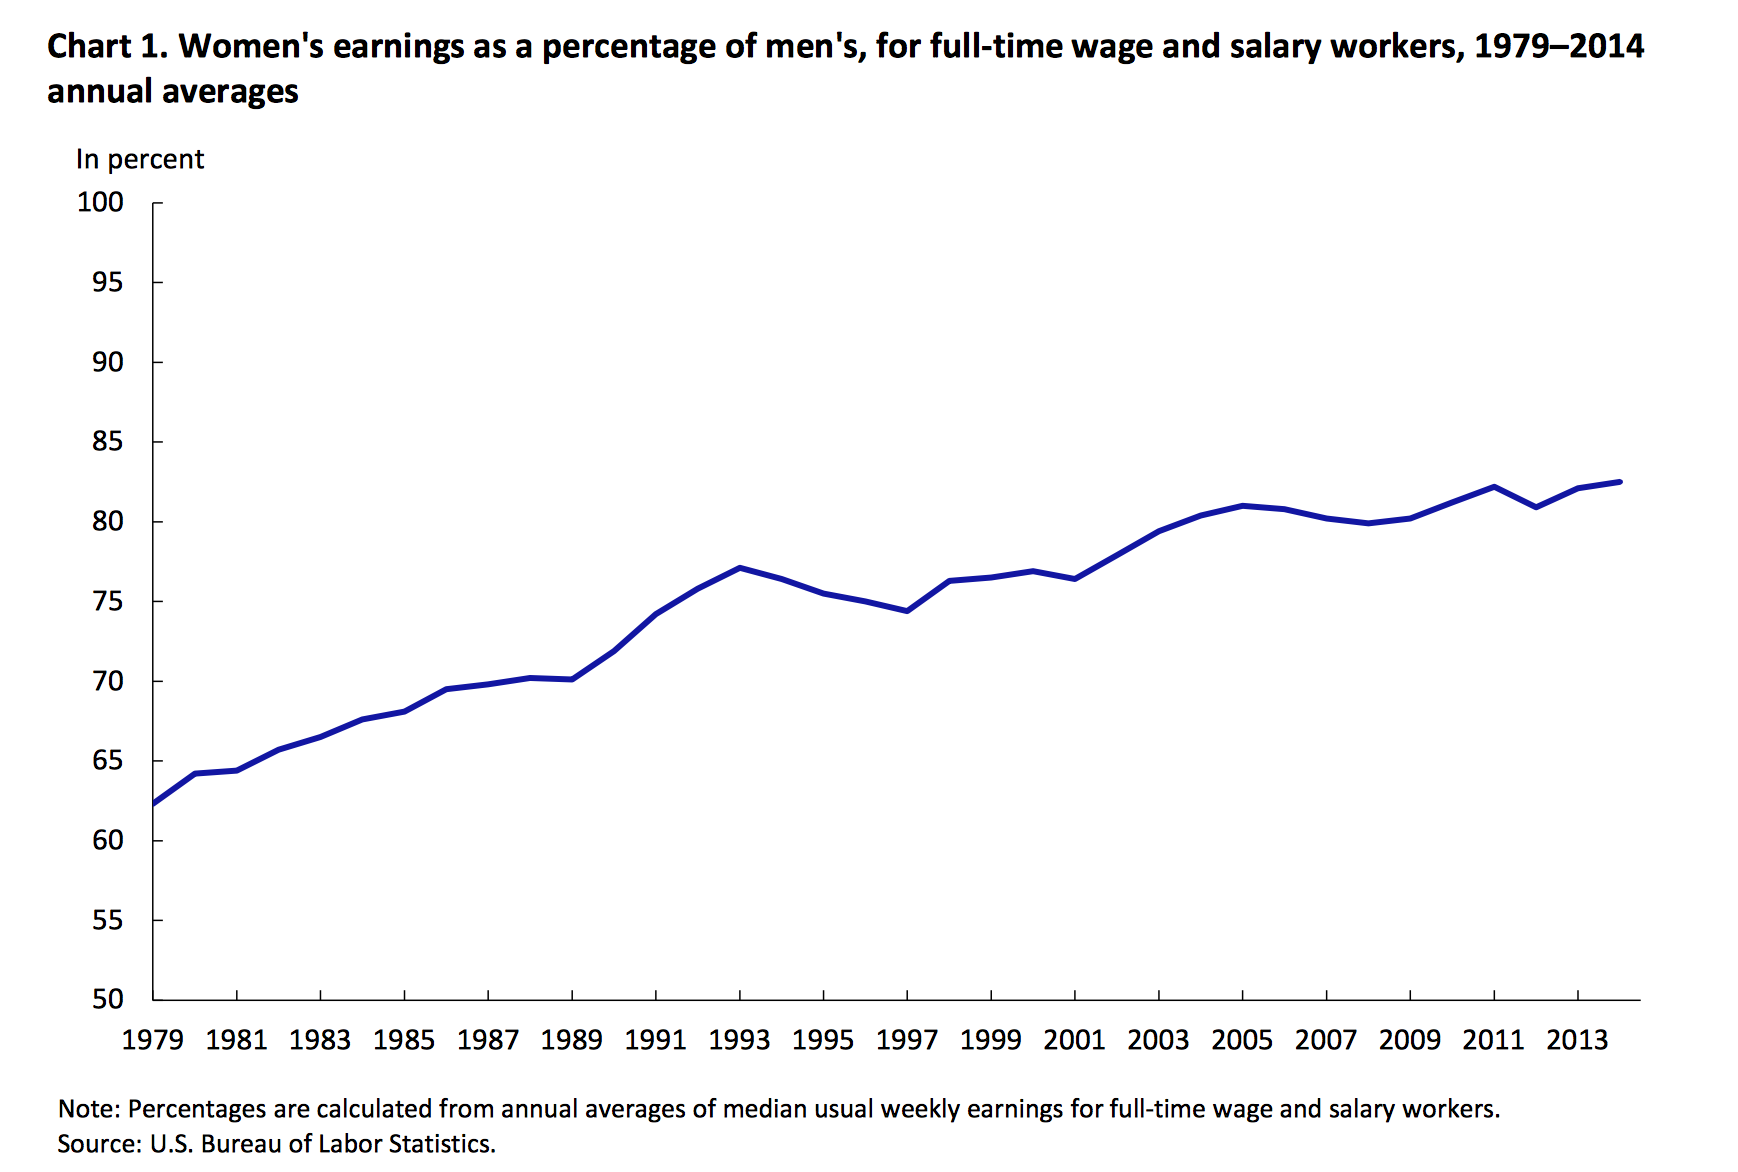
Although the gender-gap in earnings has decreased over time, it still remains firmly in place. For the US, in 2014, the gender-wage gap was 83%, meaning that women’s median earnings ($719) were 83% of those of male full-time wage and salary workers ($871). The picture for Europe is similar: in 2013 for the EU-28, the gender-pay gap defined in gross hourly earnings was 16.3%, meaning that women’s average earnings are 83.7% of male gross earnings.

Figure 1. Evolution of the gender pay gap in the US

Figure 1

Figure 2. The gender pay gap across European countries

Figure 2

In the late 90’s, human capital accumulation differences and sex-based discrimination were the main factors being discussed as potential causes of the gender gap in earnings. Although these explanations remain of first order relevance, in the last decade there has been an increasing interest in the analysis of gender-differences in psychological traits, social norms and preferences that has enriched this debate (Bertrand, 2011). In fact, together with direct discrimination and undervaluing of women’s work, labor market segregation and its subtle determinants have emerged as some of the most researched causes of the gender gap. In what follows, we will summarize some of the findings in this regard.

We could divide the recent literature that tries to explain labor market segregation into two main categories: those papers aimed at understanding the early determinants of the differential career choice by men and women (pre labor market entry) and those focusing on the later determinants – post labor market entry – which explain segregation from the labor market dynamics.

An important pre-labor market entry determinant of the gender-pay gap is the difference in education and career choices. Although many countries have taken significant steps towards achieving gender equality in education in recent decades, and girls outperform boys in most subjects, girls are still less likely than boys to be top performers in maths and to choose STEM [Science, Technology, Engineering and Mathematics] fields of study and, even when they do, they are less likely to take up careers in those fields (OECD, 2012). Among the main reasons suggested to explain this differential career choice are gender differences in some key psychological traits that are closely related; namely, competitiveness, risk aversion and overconfidence.

There is a large literature documenting gender differences in competitiveness. For example, Niederle and Vesterlund (2007) find in a lab experiment that women enter less than men into a competitive environment. Moreover, they document that the gender gap in competitiveness is not driven by performance and that, instead, gender differences in overconfidence and in taste for competition are more plausible explanations. In a later paper, these authors argue that the fact that women also perform worse than men under competition can explain part of the larger gap in mathematics performance at high percentiles of the distribution (Niederle and Vesterlund, 2010); that is, because the pressures associated with competition and risk-taking have a differential impact on boys and girls, the gender gap in math scores may not reflect only differences in skills, but also differences in responding to competitive environments. This is relevant, since math scores have been found to be a good predictor of future income and are associated with the track choice in tertiary education (Paglin and Rufolo, 1990). In fact, in a recent paper Buser et al (2014) link a experimental measure of competitiveness with the later choice of academic track and find that the gender difference in competitiveness can account for about 20% of the gender differences in track choice.

In the same line, it has also been well established that women are more risk averse than men (e.g. Booth et al., 2014; Charness and Gneezy, 2011). Risk aversion differences, as in the case of entry into competition, have also been hypothesized to have an effect on career choice and labor market segregation, as high-paying jobs may involve more risk-taking attitudes (Booth, 2009).

Similarly, several authors have also concluded that men are significantly more overconfident than women (e.g. Niederle and Vesterlund, 2007; Bengtsson et al, 2005). In fact, there is even some evidence that women are actually underconfident (Dahlbom et al, 2010; Jakobsson, 2012). These gender differences in overconfidence can also be an important factor contributing to the segregation of the labor market as they have been found to be associated with the willingness to start a new business (Koellinger et al, 2008), with risk-taking behavior in a financial context (Barber et al, 2001) or with competitiveness (Niederle et al, 2007), among others. In fact, Dahlbom et al (2010) argue that gender differences in confidence may perpetuate the segregated labor markets by means of self-selection.

Some authors have tried to explain what drives these gender differences in personality traits. This is an important question, because if these gender differences have, at least in part, a social origin and are influenced by stereotypes, then there is scope for policy intervention. In this line, Gneezy et al (2009) show that the finding that men are more competitive than women is not invariant to the social norms. They compare gender differences in self-selection into a competitive environment in a patriarchal society (Tanzania’s Maasai) versus in a matrilineal society (Northern India’s Khasi). While in the patriarchal society women self-select themselves into competition significantly less than their male counterparts, in the matrilineal society the proportions are reversed, and women actually appear more competitive than men. Booth and Nolen (2012; a, b) also point at socialization processes as potential drivers of the risk attitudes and willingness to compete of women. They study 15-year-old girls and find that their tendency to select themselves into competition and their risk aversion level is different for girls in single-sex schools than for girls in mixed-gender schools, with the former being more similar to the average boy in these aspects. D’Acunto (2015) conducts a lab experiment to measure the impact of gender identity on risk-taking behavior. He finds that making gender identity more salient increases risk taking for men. Finally, Iriberri and Rey-Biel (2011) find that making task stereotypes salient makes women underperform in a competitive setting.

The literature discussed above reveals that early gender differences in behavior, which have, at least in part, a social origin, can explain some of the difference in career choices made by males and females. However, one question remains: what sustains the gender pay gap within occupations? A number of works exist that shed light on certain institutional or job-related characteristics that can be held accountable.

Early literature focused on employers’ discriminatory promotion standards, founded on the higher probability of leaving for females (Lazear and Rosen,1990). Another phenomenon that has been of interest for earlier work is what has been dubbed as the “child-earning penalty” (e.g. Waldfogel,1998).

The latter mechanism has motivated a significant number of studies to explore the role of government-mandated parental leave as a potential remedy (Klerman and Leibowitz, 1997; Ruhm, 1998; Lalive and Zweimuller, 2009). While maternity leave policies have been found to yield mixed effects on females’ labor market attachment and earnings (Blau and Kahn, 2013), the effect of the introduction of paternity leave still remains to be explored in depth. As will become clear from the next paragraph, paternity leave policies, among others, may actually serve as a more effective instrument for bridging the gap between male and female earnings.

Present-day literature on occupational determinants of the pay gap is shifting its focus towards time-intensity and remuneration structures that affect females disproportionately. In particular, in her 2014 presidential address to the American Economic Association, Claudia Goldin put forth the hypothesis that it is convex (as opposed to linear) returns to inflexibility and long hours within high-paid (and predominantly competitive) occupations that lead to a gender divergence in earnings. This theory can explain the finding that the wage gap between males and females with similar backgrounds is much lower for women without children, who have a weaker preference for a flexible schedule. It also provides support for the thesis that lowering the cost of long-hours for females may help them benefit from these convex returns.

Some recent empirical studies have already emerged to back this theory. Wasserman (2015) provides some evidence of a tradeoff between family formation and high-paid more time-intensive specialties for female medical residents, while Cortés and Pan (2014) show that expanding women’s capacity to work longer hours can contribute to closing the gender pay gap.

Conclusion:

Although it is true that most Western societies have turned gender equality into a priority, differences in labor market outcomes for males and females persist, in part due to innate characteristics, prejudice and stereotypes and in part to labor market requirements. Closing what Goldin (2014) refers to as “the last chapter of gender convergence” thus involves addressing both the behavioral and the institutional channels behind the gender gap. As the OECD (2012) points out, aspirations are formed at a young age and thus, if we want to see gender-based wage disparities vanish, we should focus our attention on changing gender stereotypes and attitudes as early as possible. Further, mitigating the work-family trade-off experienced by women at a later stage in life should be an integral part of any effort to eliminate inequality within occupations. Working towards altering cultural norms and stereotypes, as well as creating incentives for adjusting labor conditions, may appear costly at first, but it is surely a profitable investment in gender-equality in the long term. Because closing the gender-pay gap is not a zero-sum game where one group of individuals gains at the expense of others. Rather, it is a step towards a more equitable society, which, without a doubt, would benefit us all.

Bibliography:

Barber, B. M. and Odean, T. (2001). “Boys Will be Boys: Gender, Overconfidence, and Common Stock Investment”, Quarterly Journal of Economics, 116, 261–292.

Bengtsson, C., Persson, M., Willenhag, P. (2005) “Gender and overconfidence.” Economics Letters, Vol. 86, 199 – 203. Continue reading “Mind the (Gender) Gap”

EU Banking Union: What it is and What it is Not

Arturo Pallardó ’15 (Master in Economics) and Christopher Gandrud (Lecturer, City University London) have put together a summary of the European multilevel bank regulatory structure.

banking union

The health of the European banking system has come back into the media spotlight. The recent fall in bank shares; the creation of the Italian “bad bank”; and Britain’s demands to shield its banks from rules governing the euro region; suggest that the debate on the design and functioning of the European banking regulatory architecture will be on the table in the following months.

Given the complex and evolving nature of European banking regulation, there is much confusion about what has already been established and what plans are being discussed. We hope to clarify the current and proposed state of the European bank regulatory architecture. We differentiate which rules and institutions form the so-called “banking union” and which rules are part of the more general EU single market for financial services.

You can read the full summary on bankingunion.eu, a website run by Arturo that curates content and fosters debate on the European banking union’s evolution.

Follow the authors on Twitter @bankingunion_eu and @chrisgandrud