Economic impacts of the Northern Sea Route

This research paper explores the Northern Sea Route (henceforth NSR), which is a shipping lane located along the Russian Arctic coast, and its predicted impacts on the relevant economies, especially Russia, in 2013, the time when the NSR was about to play an instrumental role in future shipping. This paper will also examine the economic implications.

Russia is one of the largest economies in the world by nominal value and even ranks among the top ten by purchasing power parity (CIA factbook). Nevertheless, it is still classified as a developing country.

figure-1

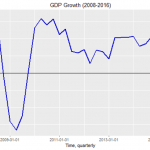
Figure 1: Russia’s GDP growth from 2010 to 2013 (Kolyandr and Ostroukh, 2013)

In 2012, Russia’s economic growth was solid, at a comfortable 3.4%, while the global economy was stuck in recession. The Russian rate of growth was faster than that of many other developing countries.  Moreover, unemployment fell to 5.4%, which was a record low for the past 20 years. Not only that, wages grew considerably fast (see Figure 2). In 2013, Russia’s economy started to display signs of weakness. Its economic growth dropped to half the level of what it was in the decade leading up to the 2008 crisis, falling short of economists’ consistent expectation of a 1.9 percent rise. Some analysts and officials even started comparing the situation to a recession. In early 2013, the industrial output dropped for the first time since 2009. Furthermore, inflation increased in the second half of 2012 and was set to remain high in early 2013 (Kolyandr and Ostroukh, 2013).

figure-2

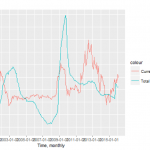
Figure 2: Real wage growth in Russia in 2012 (trading economics)

One needs to adopt an international perspective when examining this case. The increase in inflation in Russia was related to three factors. First, overall inflation increase was due, in part, to the increase in food inflation triggered by the drought in Russia, exacerbated by a rise in prices among international grain producers, as well as higher consumption taxes on alcohol. Second, the rise in administrative prices in July and September 2012 and January 2013 led to inflated prices for services. Finally, there was an upward bend in core inflation, which excludes food and energy. After it had stabilized at approximately 5.7 percent for a few months, it increased from 5.1 percent in May 2012 to 5.8 percent in October 2012 (World Bank, 2013). Countries with high inflation face high government borrowing costs as a result, since lenders need to be compensated for the loss of their investments’ purchasing power. Low demand for industrial goods remained the main challenge for Russian businesses and, as a consequence, enterprises were not stimulated to invest and expand their production.

Russian official rates are known to have been high ever since the Perestroika. With an official interest rate of 8.25%, money and investment became very expensive relative to Russia’s main competitors. Banks would often ask for two-digit interest rates when lending. Consequently, this resulted in higher costs for loans and borrowed capital, thereby giving Russian stakeholders a competitive disadvantage when making investments. However, interest rates decreased from 15.2% in 2009 to 9.1% in 2012 (see Figure 3).

figure-3

Figure 3: Interest rates for corporate loans on average (World Bank, 2013)

With regard to Russian shippers and ports, capital costs for investment decisions decreased by 40.13% on average. This certainly played in favor of the Russian shipping and port industry. On the other hand, other countries experienced a record low in interest rates. The EU, which harbors the competing ports as well as the most competitive shippers interested in the Northern Sea Route, will lend money at 0.5% through the European Central Bank. As a reference average lending rates to prime customers would therefore be at 3% (European Central Bank, 2013). Bearing these facts in mind, it is clear that pressure from finance-related costs had eased slightly. At the same time, however, competing companies from the EU would be able to acquire considerably cheaper capital than the companies located in or around St. Petersburg.

As shipping rates are almost exclusively quoted in European Euros and American Dollars, foreign exchange rates against those currencies played a major role in every internal and external calculation for shippers, ports and other stakeholders. In September 2013, 43-45 Russian Ruble could be exchanged for a Euro. Moreover, the Russian currency stood at around 32 RUB against one Dollar. However, the most important factor in foreign exchange related to long-term investment decisions (e.g. financing port infrastructure or new ships) as well as for daily money inflows (i.e. port handling fees, shipping revenue) is / was (present tense if it is a fact in general) volatility. The lower it is, the more predictable and, hence, the easier it becomes to calculate an investment decision for parties involved, i.e. the investor and the lender. Consequently, analyzing the Ruble’s performance and its volatility with Bollinger bands appears to be a suitable approach (Murphy, 1999).

As we see from Figure 4, volatility between the US Dollar and Russian Ruble clearly decreased compared to its trend at the beginning of the economic crisis in 2008 and 2009. However, volatility in this currency pair was still high enough to keep most American companies away from the Northeast Passage and its route. The volatility of the Ruble against the Euro was smaller. This was mainly due to steady, high volume of trade balance based on oil, gas and other raw materials, which offset the effects of an unstable Russian economy. Therefore, banks and especially forex finance were more optimistic about investments. For instance, they committed themselves to in- and outflows of the Russian Ruble.

figure-4

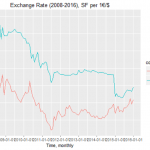
Figure 4: Rates of US Dollar and Russian Ruble with Bollinger Bands (Yahoo Finance 2013)

To sum up, the NSR was meant to have a huge impact on the involved economies, especially Russia. But its neighboring countries, or countries otherwise depending on shipping, were likely to also be affected. Nevertheless, there will be more time needed to judge whether the predictions were correct.

The True Cost of Polarization

“There’s No Such Thing as a Free Lunch” – Milton Friedman

In their first lesson of economics, students are introduced to the concept of scarcity – an inherent condition in a world of limited resources – and, as a result, the existence of opportunity costs; Milton Friedman’s famous quote “There’s No Such Thing as a Free Lunch” echoes this idea that everything has a cost, even when it is not obvious. When it comes to government decisions, costs are often scrutinized: the cost of an investment, of giving (or not giving) a public service in concession or implementing a policy; however, the costs of political polarization are rarely analyzed.

What is the cost of political polarization?

Or, rather, which is the most valued asset lost for having political polarization? Certainty. In this essay, the author will provide arguments in favor of the hypothesis that the opportunity cost of the increasing gap between political attitudes of politicians towards major policy dimensions (trade, migration, gender, racial integration, public expenditure) is uncertainty and will discuss its negative effects on economic performance.

A first approach to studying the economic effects of uncertainty resulting from political activities is observing economic markets’ performance during electoral cycles. Brandon and Youngsuk (2012) estimated the effect of elections over corporate investment. Results indicate that, after setting control variables for investment opportunities and economic environment variables, corporate investment rates dropped, on average, by 4.8 percentage points the year prior to elections. In countries with polarization, the effect is expected to increase due to the risk of abrupt changes in policy. The changes may be moderate, for example: contract regulations, taxation, trade policy, or more drastic actions like expropriation of possessions and hostility towards non-supporters. Empirical evidence reveals that political polarization affects investment not only during electoral cycles, but also discourages long-term investments, with investors instead opting  to minimize their risk and making short-term opportunistic solutions such as  asset stripping, and intensive lobbying with state officials (Frye. 2002).

Other negative effects of polarization

Especially in countries with parties that exhibit diverging ideologies such as ex-communists and anticommunists, other negative effects of polarization are the imposed barriers to create consensus. There is a constant conflict over the economic reforms to be implemented, given the conflicting principles, and it does not allow politicians to reach agreements to effectively address economic crisis with coherent policies (Frye. 2002).

The struggle between opposing factions also has a detrimental effect on  the quality of institutions by increasing the state officials’ incentives to make opportunistic decisions, for example populism, clientelistic relationships, bribing and interference of power groups in government policies, just to name a few

According to a growing mass of literature on the subject, when a country lacks strong institutions and has a polarized government, it will be more likely to default on sovereign debt. It is important to bear in mind that sovereign debt crises   do not occur only when governments choose to default, as recent events have shown that crises can arise from investor’s uncertainty about a country’s ability or intentions to honor its responsibilities. Qian (2012) uses an economic model to show the dynamics between the quality of institutions, the level of government polarization and the sovereign default risk, for a sample of 90 countries. Her findings support the premise that the lack of strong institutions and a clear set of rules allows powerful groups to capture government and influence policies to their benefit, without considering their impact on other groups.

Additional evidence of the negative effects of polarization and weak institutions is found when combined with a globalized financial market. In particular, countries with low income and weak institutions are perceived as unreliable by investors and experience a threshold effect that will hinder their access to all the benefits of globalization, as presented by Alfaro, Kalemli-Ozcan and Volosovych (2008), as well as by Kose, Prasad and Taylor (2011).

Moreover, Broner and Ventura (2006) discuss the conditions under which globalization lead to higher financial market volatility. According to their model, the instability of domestic financial markets can be explained by: 1) uncertainty of governments’ behavior (incentives to default on foreign liabilities increased with globalization) and 2) the probability of a financial crisis (i.e., it depends largely on the nature of regulations and strength of judicial systems to enforce contracts). As a result of financial liberalization and the existence of the previously mentioned sources of uncertainty, the economy will alternate between two possible outcomes: an optimistic equilibrium (in which institutions are strong in enforcing contracts) or a pessimistic equilibrium (one with weak, opportunistic institutions). In a polarized government, the effect of the uncertainty sources would be amplified, potentially destroying the possibility of an optimistic equilibrium.

After analyzing polarized countries using these arguments, it is not a surprise to find that some countries have low levels of investment, slow economic growth, high volatility and recurring economic and institutional crises.

 “There’s No Such Thing as a Free Lunch”… especially when it comes from a politician.

References

Layman, G. C., Carsey, T. M., & Horowitz, J. M. (2006). Party polarization in American politics: Characteristics, causes, and consequences. Annu. Rev. Polit. Sci., 9, 83-110.

Baldassarri, D., & Bearman, P. (2007). Dynamics of political polarization. American sociological review, 72(5), 784-811.

 Qian, Rong. 2012. Why Do Some Countries Default More Often Than Others? The Role of Institutions. Policy Research working paper; no. WPS 5993. World Bank. © World Bank.

Frye, Timothy. 2002. The Perils of Polarization: Economic Performance in the Postcommunist World. World Politics, Volume 54, Number 3, April 2002, pp. 308-337

Brandon. J, Youngsuk, Y. 2012. Political Uncertainty and Corporate Investment Cycles. Journal of Finance, 67 (2012), 45-83.

Broner, F. and Ventura, J., 2006. Rethinking the effects of financial globalization. The Quarterly Journal of Economics, p.qjw010.

Corporación Latinbarómetro, Socio- demographic variables (2015). Retrieved from http://www.latinobarometro.org/latOnline.jsp

What economists do: Talking to Philip Wales, UK Office for National Statistics

Wondering what economists get up to in the real world? The BGSE Voice team spoke to Philip Wales, Head of Productivity at the UK Office for National Statistics about what economists like him get up to, and what makes a good professional economist.


First of all, could you please tell us about yourself: what is your background, and what do you do at the ONS?

My name is Philip Wales; I’m Head of Productivity at the Office for National Statistics. I’ve been working at ONS for just over five years, and have held a range of different posts over that period. Before I started work here, I was studying for my PhD at the London School of Economics, and prior to that I was a graduate economist at a private sector consultancy.

In my current position, I manage a team of 14 economists with responsibility for the production and analysis of the UK’s core productivity statistics. We produce the UK’s main measures of labour productivity as well as estimates of multi-factor productivity. It’s an interesting area which has got a lot of attention since the onset of the economic downturn and the ‘Productivity Puzzle’. We regularly answer queries from the press, academics and a range of other experts; we often contribute to external seminars and talks at big international conferences, and our statistics help to inform the national policy debate.

The part of my job that I enjoy most is working with the detailed survey data that ONS receives to understand developments in the UK economy. Over the last few years, I’ve analysed the UK’s Labour Force Survey, the Annual Business Survey and the Annual Survey of Hours and Earnings. I’ve worked with micro-level information gathered for the Consumer Prices Index and with survey data on household income and expenditure, and we’ve produced a range of outputs using these resources.

What other things do economists do at the ONS? 

There are more than 100 economists at ONS, engaged in a wide variety of activities. In our central team, our economists scrutinise and sense-check our economic data. They are responsible for building a coherent narrative around ONS’ economic statistics, and help the media, outside experts and other interested users to understand recent developments. ONS economists also conduct in-depth research and analysis on our micro-level datasets to support user understanding. At times when an economic aggregate is behaving unusually, or when there is a demand for more detailed information, a clear understanding of recent developments informed by high-level data handling and analytical skills is critical.

Alongside work on these data-driven questions, our economists are also deployed to work on detailed methodological and measurement questions. How do you go about modelling the depreciation of a firm’s capital stock? What is the difference between a democratically- and a plutocratically-weighted price index? How have changes in workforce composition affected average wage growth? In all of these cases, economists work alongside methodologists and statisticians to draw grounded, intellectually-robust conclusions about our approach

Finally, ONS economists are also involved in supporting the corporate functions at ONS. We work on business cases – seeking to value the costs and benefits of big projects – as well as modelling the implications of changes in pay rates for the department’s budget. In all of these roles, the skill set that economists bring to the role is highly valued, and our numbers have grown as a result

What are the main challenges you face as an economist at the ONS?

One of the biggest challenges that economists face – both at ONS and elsewhere – is communicating our findings in a clear, concise and accessible form. Even when speaking to other, technically minded colleagues, communicating the findings of a piece of analysis clearly can be a real challenge – especially if it is at the more complicated end of the spectrum. Communicating our findings to a non-technical user-base or – occasionally – members of the media, can be even more difficult.

In my experience, good preparation is central to achieving a good result. I try to pitch my work in a clear, intuitive manner, using thought-through and interesting graphics to help users to understand the questions that I’m posing and the answers that my analysis provides. Above all, I try to weave a narrative through my work – helping the audience to understand what the broader picture is, as well as our detailed findings. Clear communication is especially important when you work for an institution like ONS – where users are looking for clear messages on recent developments. Expert knowledge is certainly very important and the world is a complicated place – but communicating difficult concepts in a clear and intuitive manner is a key skill for economists in all walks of life.

In your opinion, what makes a good professional/public sector economist? What does the ONS look for in economists?

Besides the good communication skills, a good economist needs solid data-skills, an enquiring and inquisitive mind and the capability to bring together and synthesise information from a range of different sources within a coherent framework.

The best economists that I’ve worked with at ONS have all of these attributes. Confronted with a dataset, they’re interested in exploring it and visualising it in different ways. They ask questions about what the data can tell us about the way that different agents are working in the economy, and whether that accords with our intuition or conceptual approach. They explore how the dataset was constructed, what limitations this imposes and think about how applicable the survey results are for the population as a whole. They deploy their skills of data-analysis and their economic theory to explain what is going on, and they build intuitive examples and graphics into their work to communicate their meaning to others. They have a real desire to learn about the economy through the data that we collect and they have a clear interest in helping others to understand what is going on.

These economists tend to be enthusiastic, inquiring and curious in their job, with a rapacious appetite for detail and knowledge. They have one eye on the datasets, another eye on their methodology and theory, and a clear line of sight to an issue central to economic policy. It’s this blend of economic skills that make a good economist, and that’s what I’m looking for when I interview prospective ONS economists.

Do you have any advice for the current generation of economics students?

I’m wary of giving advice – as one size rarely fits all – but I think there’s a lot of interesting developments taking place in economics that students should look to exploit. Firstly, the economic downturn and the financial crisis created an appetite to revisit what had become established theoretical tenets of the field and the nature of our modelling. A sceptical, but fair-minded assessment of the models and approaches that you learn is really important.

Secondly, as the field has progressed, the gulf between theoreticians and empiricists has grown very large, with relatively few economists now able to bridge the gap between the frontier of theory and the frontier of measurement. Understanding the strengths and weaknesses of both is central – and will be more so in the future. As more data becomes available, having both a decent theoretical foundation and a strong set of applied empirical skills will be critical.

Finally, if I had my time again, I’d want to make the very most of the opportunity that studying offers. Go to the talk that you’re interested in; speak to the lecturer afterwards; think critically about how you would extend someone else’s analysis and try and come up with ideas of your own. It’s a great time, enjoy it!

Convenience Effect on Birth Timing Manipulation: Evidence from Brazil

According to the United Nations Children’s Fund, Brazil ranked first place with the highest cesarean section rate among 139 countries in the world for the period of 2007-2012.[1] In 2009, the number of surgical births surpassed vaginal deliveries. During the years of 2012-2014, cesarean delivery (CD) corresponded to 57% of all registered births in the country. Another less but still invasive medical intervention is labor induction. This is a technique used to bring on or speed up contractions and thus anticipate vaginal births. For the period of 2012-2014, 33% of all registered normal deliveries in the country occurred after induced labor. Therefore, only 29 out of 100 births in Brazil occurred in the form of natural birth, through a spontaneous (non-induced) vaginal delivery.[2]

Such medical interventions (CD and labor induction) allow for manipulation in the timing of birth. Although birth timing can be altered due to medical reasons (e.g., when labor could be dangerously stressful or in case of post-term pregnancies), the existing evidence suggests that it is also manipulated for reasons other than the health of the fetus or of the mother. Mothers’ incentives to intervene in the timing of their deliveries are usually financial when compensations are involved, such as baby bonuses (Gans and Leigh, 2009) or tax savings (Dickert-Conlin and Chandra, 1999), or even related to cultural issues (Lo, 2003). Doctors’ incentives tend to be determined by risk-aversion (Fabbri et. al, 2015) or convenience (Gans et al., 2007).

As CD can be scheduled for medical reasons, a concentration of scheduled CD’s in convenient moments does not constitute enough evidence to suggest that deliveries are being scheduled due to convenience motivations. However, since complications during delivery that require an emergency CD should be randomly distributed across time, a concentration of unplanned CD’s during convenient times indicates that reasons other than the protocol are playing a role. Brown (1996) and Lefèvre (2014) show evidence on this matter. Both papers suggest that physicians induce CD in the labor room during convenient moments. Thus, physicians’ convenience motivations as well as other incentives correlated to convenient moments could be at play.

Convenient times usually coincide with times when it might be safer to deliver. It is also during non-leisure days and usual business hours that the largest capacity of hospital staff is on-shift and medical staff is fresher. If this is the case, then doctors who are risk-averse or altruistic might have preferences to allocate complex deliveries on those moments when risk can be minimized. Fabbri et al. (2015) provide evidence of risk aversion attitudes for a sample of women admitted at the onset of labor in a public hospital in Italy.

In my thesis from UFRJ, I tested whether convenience effects play any relevant role in birth-timing manipulation in Brazil. More specifically, I investigated if births that would have occurred after spontaneous labor during inconvenient times are anticipated to convenient times. I adopted several strategies in order to isolate the convenience effect from potential risk aversion attitude.

First, I used a new type of inconvenient days that may attenuate risk aversion attitudes in manipulating the timing of births: business days in-between holidays. As these are business days, hospitals should be fully-staffed. However, risk-averse physicians may still manipulate the timing of births in order to eliminate the possibility of women going spontaneously into labor on the surrounding leisure days. Second, I analyzed the results by hospital funding. Public funded hospitals provide a context where women do not actively participate in the decision-making process. This scenario enabled me to attribute the results to physicians. Third, I further investigated the results by level of risk. While birth timing manipulation motivated by convenience should happen mostly among low-risk births, timing manipulation guided by risk aversion should be concentrated in high-risk births – as in this latter case the goal is to minimize the risk of low quality hospital services.

Using daily data on birth records, I constructed a daily panel of number of deliveries by hospitals for the period 2012-2014, with information on hospitals, deliveries (e.g. type of birth procedure and nature of labor), pregnancy, mothers and newborns. Having classified births as low-risk and high-risk according to observable variables (e.g. mother’s age below 18 or above 35 years old, multiple pregnancy, newborn with congenital anomaly), I ended up with daily panels of number of high and low-risk deliveries by hospital.

As my goal was to understand if births that would have occurred after spontaneous labor were anticipated, I ran regressions of the number of births after spontaneous labor on days in-between holidays. I found a significant negative result, which suggests that either convenience or risk-aversion motivations were playing a role. Then, I verified that the results were robust to the restricted sample of public funded hospital. Hence, I attributed the results to physicians’ motivations. Finally, I further restricted the sample to low-risk births and re-estimated the results. Having found out that the findings were driven by low-risk deliveries provided further evidence that births were being anticipated due to physicians’ convenience effect. Moreover, I ran the same regressions for the days preceding the leisure period and verified an increase of cesarean sections, which reinforces the previous results that births that would otherwise have happened after spontaneous labor occurred instead by the scheduling of cesarean sections.


References

[1] http://data.un.org/Data.aspx?q=cesarean&d=SOWC&f=inID%3a219

[2] CD rates extracted from the Brazilian National System of Information on Birth Records (Datasus/SINASC).

Borra, C., González, L.; Sevilla, A. Birth timing and neonatal health. The American Economic Review, v. 106, n. 5, p. 329-332, 2016.

Borra, C., González, L.; Sevilla, A. The impact of scheduling birth early on infant health. Working Paper presented at Tinbergen Institute, 2016.

Gans, J.S.; Leigh, A. Born on the first of July: An (un)natural experiment in birth timing. Journal of Public Economics, v. 93, n. 1-2, p. 246-263, 2009.

Dickert-Conlin, S.; Chandra A. Taxes and the timing of births. Journal of Political Economy, v. 107, n. 1, p. 161-177, 1999.

Fabbri, D.; Castaldini, I.; Monfardini, C.; Protonotari, A., Caesarean section and the manipulation of exact delivery time. HEDG working paper n.15, University of York, 2015.

Gans, J.S.; Leigh, A.; Varganova, E. Minding the shop: The case of obstetrics conferences. Social Science and Medicine, v. 6, n. 7, p. 1458-1465, 2007.

Brown, H.S. Physician demand for leisure: Implications for cesarean section rates. Journal of Health Economics, v.15, p. 233-242, 1996.

Lefevre, M. Physician induced demand for C-sections: does the convenience incentive matter? HEDG working paper n. 14, University of York, 2014.

Why Are Negative Interest Rates Failing? An Analysis of the Swiss Case

Miguel Alquezar and Gabriel Bracons (both Economics ’17 and alumni of UPF Undergraduate Program in Economics) present their Bachelor thesis research work, supervised by Barcelona GSE Affiliated Professor Luca Fornaro.

Standard macroeconomic theory tells us that a reduction of the interest rates, even into the negative ground, should lead to an increase in consumption and investment through the real interest rate channel, by lowering liquidity-constraints on firms and households and discounting future returns. On the currency market, such a measure should discourage capital inflows, leading to a lower demand of the currency, and thus its depreciation. However, the policy also erodes the profitability of banks as it reduces the net interest margins, and hence increases their own default risk. Furthermore, anomalies in the valuation of returns and payment streams usually put pressure on the financial institutions to redesign financial transactions functioning. Finally, as this policy was unconventional, uncertainty has been a key parameter in the short run, thus increasing results volatility and counteracting most of its efficiency.

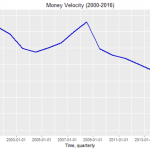
On our attempt to see to which extent theory matched reality, we checked the main economic indicators of the Swiss economy and found that real economic variables such as real GDP, unemployment rate, money velocity and loan rate were not affected by the negative interest rates policy (see charts above).  But this monetary policy was not neutral either as other monetary variables such as currency in circulation (M2) and exchange rate with the Euro have been negatively impacted. Theory was also proven wrong by saving deposits which actually increased (see charts below). This adds evidence to the fact that negative interest rates have failed to achieve their expected benefits, mainly due to the increase in uncertainty generated by this “unconventional” policy.  Remarkably, Swiss banks’ balance sheets show that even under negative interest rates, deposits have not sunk and lending has been steadily increasing, especially in mortgages. The only variable that seems to start to react is inflation, which is expected to be around 1% in 2017.

Conclusions

According to the theoretical implications presented above, real economy and inflation should improve as well as the whole set of variable related to them, triggering a vigorous recovery. However, real economy has not reacted to the negative interest rates as expected and the real variables remain weak by Swiss standards. Moreover, nominal variables and other indicators such as money velocity, money multiplier or loans growth have also not reacted as predicted. The fact that banks do not charge clients appears to be the main problem as they do not transfer the interest, thus accumulating more risk without further profits. This means that in the long run, the banking sector has to find a different way to offset losses that come from the negative interest rates. To solve this situation, a set of new policies has been proposed, ranging from punishing banks that do not lend money with different interest rates, to giving strong incentives to banks to lend some share of their assets in exchange of very generous conditions. Additionally, some changes to the basic model have been suggested to reduce the gap between theory and reality. Hence further work on the adoption of these new policies and changes to the model should be a fruitful line of research.

You want to learn more about this very interesting and topical issue? Consult their full research paper here: Why are negative interest rates failing?

Is the fat tax really effective?

Recently, some European countries, including Spain, have considered introducing new taxes to reduce their budget deficits. Among the set of measures, they have proposed a fat tax, which has the aims of not only increasing revenues, but also reducing junk food consumption, and thereby obesity rates and the concomitant health costs.

Although this is what we expect from the theory, empirical evidence is revelatory of a different picture. Firstly, the tax is not fully reflected in the prices of the products that have been targeted. In fact, in the countries where the tax has been imposed, supermarkets and other food stores have played with prices and margins of other products in an attempt to avoid raising the prices of the products that are subject to taxation. For example, some firms have increased the prices of substitutes (e.g. sodas with low calories) while spreading the higher cost of taxed food onto other foods or own-branded products that typically have higher profit margins. Another interesting reaction from the supply side has been that producers have been substituting those taxed products with un-taxed products that are just as unhealthy. Additionally, they have also reduced the amount of some inputs below the legal threshold to avoid the fat tax. Ostensibly, these tricks have clearly diminished the effectiveness of the tax.

On the demand side, we have also seen interesting reactions. Firstly, it is important to notice that people who consume more junk food are less responsive to a price increase than moderate consumers. Hence, the fat tax is not actually benefiting its most important target audience. Furthermore, there is an important substitution effect as all products have, on the whole, become more expensive, consumers have switched to cheaper goods of lower quality.

According to different studies, the impact of the fat tax has not achieved its desired outcomes, and there has not been a significant reduction in obesity rates. Therefore, although some studies claim that what is needed is a higher tax of at least 20% to lead to a sizeable decrease in obesity rates, it is unlikely that this policy alone would be effective enough. Moreover, it is a highly regressive tax because poor people are spending more on less healthy foods. In view of this, we should instead study the introduction of other interventions such as heathy food subsidies, campaigns promoting a healthy diet, health education at school to try to curb obesity through moral suasion from an early age and , albeit a very unpopular one, taxing people according to their body mass index.

References:

Leicester and F. Windmeijer. The ‘fat tax’: economic incentives to reduce obesity. Institute for Fiscal Studies

ECORYS (2014). Food taxes and their impact on competitiveness in the agri-food sector. ECSIP

Frank, S.M. Grandi and M.J. Eisenberg (2013). Taxing junk food to counter obesity. American Journal of Public Heath

Cornelsen, R. Green, A. Dangour and R. Smith (2014). Why fat taxes won’t make us thin. Journal of Public Health.

Optimal density forecast combinations (Unicredit & Universities Job Market Best Paper Award)

Greg Ganics (Economics ’12 and PhD candidate at UPF-GPEFM) provides a non-technical summary of his job market paper, which has won the 2016 UniCredit & Universities Economics Job Market Best Paper Award.

authorEditor’s note: In this post, Greg Ganics (Economics ’12 and PhD candidate at UPF-GPEFM) provides a non-technical summary of his job market paper, “Optimal density forecast combinations,” which has won the 2016 UniCredit & Universities Economics Job Market Best Paper Award.
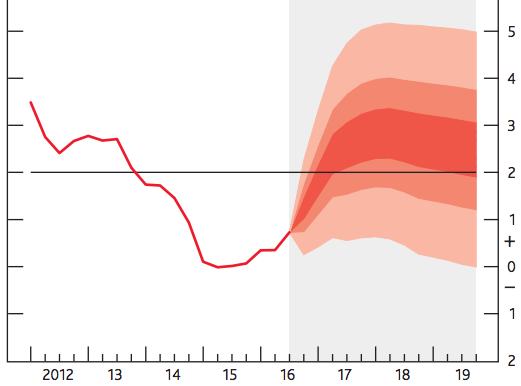

After the recent Great Recession, major economies found themselves in a situation with low interest rates and fragile economic growth. This combination, along with major political changes in key countries (the US and the UK) makes forecasting more difficult and uncertain. As a consequence, policy makers and researchers have become more interested in density forecasts, which provide a measure of uncertainty around point forecasts (for a non-technical overview of density forecasts, see Rossi (2014)). This facilitates communication between researchers, policy makers, and the wider public. Well-known examples include the fan charts of the Bank of England, and the Surveys of Professional Forecasters of the Philadelphia Fed and the European Central Bank.

chart
BOE fan chart. Source: Bank of England Inflation Report, November 2016

Forecasters often use a variety of models to generate density forecasts. Naturally, these forecasts are different, and therefore researchers face the question: how shall we combine these predictions? While there is an extensive literature on both the theoretical and practical aspects of combinations of point forecasts, our knowledge is rather limited about how density forecasts should be combined.

In my job market paper “Optimal density forecast combinations,” I propose a method that answers this question. My main contribution is a consistent estimator of combination weights, which could be used to produce a combined predictive density that is superior to the individual models’ forecasts. This framework is general enough to include a wide range of forecasting methods, from judgmental forecast to structural and non-structural models. Furthermore, the estimated weights provide information on the individual models’ performance over time. This time-variation could further enhance researchers’ and policy makers’ understanding of the relevant drivers of key economic variables, such as GDP growth or unemployment.

Macroeconomists in academia and at central banks often pay special attention to industrial production, as this variable is available at the monthly frequency, therefore it can signal booms and busts in a timely manner. In an empirical example of forecasting monthly US industrial production, I demonstrate that my novel methodology delivers density forecasts which outperform well-known benchmarks, such as the equal weights scheme. Moreover, I show that housing permits had valuable predictive power before and after the Great Recession. Furthermore, stock returns and corporate bond spreads proved to be useful predictors during the recent crisis, suggesting that financial variables help with density forecasting in a highly leveraged economy.

The methodology I propose in my job market paper can be useful in a wide range of applications, for example in macroeconomics and finance, and offers several avenues for further research, both theoretical and applied.

References:

Ganics, G. (2016): Optimal density forecast combinations. Job market paper

Rossi, B. (2014): Density forecasts in economics and policymaking. Els Opuscles del CREI, No. 37

‘Trumponomics’, a solution to Secular Stagnation?

With Donald Trump voted in as the 45th US President, the world economy has witnessed another sobering reminder of the rise of populism, inward-looking politics and a sweeping anti-establishment wave, having barely recovered from the last with Britain’s vote to leave the EU. Initial market turmoil from Trump’s surprise victory last Thursday has reversed, as fiscal stimulus takes centre stage on Trump’s economic agenda, but does the Trump plan have what it takes to kick-start the US economy?

We have a great economic plan, we will double our growth and have the strongest economy anywhere in the worldwas the promise made by US President –elect Donald Trump; to “make America great again”. Having won the confidence of millions of Americans, against a backdrop of stagnant productivity, weak wage growth and rising inequality, Trump’s “great economic plan” has a lot to deliver.

With the US economy having grown a little over 2 per cent on average over the last six years, and forecast to grow slightly under for the next six[i], doubling of current growth would require something quite extraordinary. Even compared to pre-crisis growth of 3 per cent per year in the decade preceding the financial crisis, this target looks ambitious.  If achieved, however, the US economy could close over half of the shortfall compared to its pre-crisis trend by 2021, as in figure 1.

figure-1

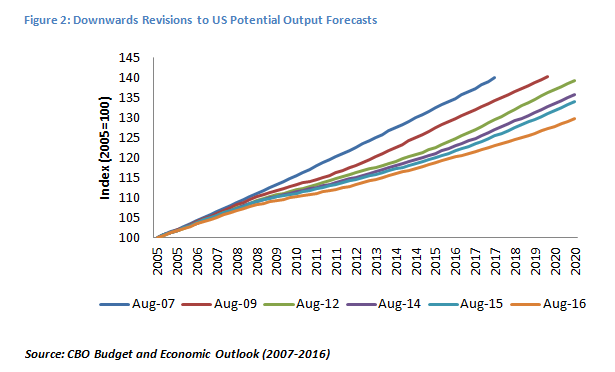
The challenge then becomes finding new drivers of productivity growth to boost economic activity, and lifting lacklustre demand. Since the financial crisis, this has proven difficult, despite ultra-loose monetary policy. Moreover, growth in potential output has failed to materialise during the recovery, as evident in the US Congressional Budget Office’s consecutive downwards revisions to US potential output since 2008, as in figure 2. Figure 2 has come to be closely associated with an idea that the weak recovery may have at its heart a more structural rather than cyclical cause, also known as Secular Stagnation.

figure-2

The Secular Stagnation Hypothesis

The term secular stagnation was initially coined by Alvin Hanson in 1938, in the aftermath of the Great Depression, questioning whether demand would be sufficient to support future economic growth.  After over 70 years, former US Treasury Secretary Larry Summers revived this debate, after observing the weak economic recovery in advanced economies despite historically low interest rates. Summers suggests that the real interest rate, required to keep full employment and balance investment and savings, may actually be negative.

This may be due to a chronic shortfall of demand from a lack of productive investment opportunities and a build-up of savings, driven by demographic factors such as ageing populations or a fall in the relative price of capital. Moreover, with advanced economies experiencing low levels of inflation, boosting demand by reducing real interest rates becomes more difficult with monetary policy becoming ineffective at the zero lower bound, shifting the onus to fiscal and structural policies to support economic growth

The secular stagnation hypothesis finds some support in the evidence, with the real interest rate observed to be declining since the early 2000’s[ii]. However, former US Federal Reserve Chairman Ben Bernanke interprets this as evidence of a temporary or cyclical “global savings glut”[iii]. Considering the open economy, he suggests excess savings have built up due to large current account surpluses held by oil producing and emerging economies. As Bernanke emphasises the root of the problem matters for the policy prescription: a structural demand deficit (under Secular Stagnation) may require a fiscal expansion, while a temporary excess or imbalance of savings would be best addressed through increasing mobility of international capital flows.


Weak growth – a global problem

The challenges of weak growth and productivity are not solely faced by the US. Similar trends have been observed across advanced economies such as the Euro Area and Japan, with potential output consistently disappointing to the downside[iv]. The IMF’s World Economic Outlook published last month revised down again forecasts for growth in advanced economies, to 1.6 per cent in 2016 and 1.8 per cent in 2017, down by -0.5 and -0.3 percentage points from start of this year alone. Furthermore, the IMF warned that “persistent stagnation in advanced economies could further fuel anti-trade sentiment, stifling growth”.


The “great economic plan”….

As it slowly emerges and gains coherence, Trump’s economic plan is a cocktail of fiscal expansion and trade protectionism.  In theory, a package of tax cuts and deregulation should incentivise more investment by lowering the marginal tax rate on investment returns. This could provide a pivotal boost to the US economy – provided it doesn’t break the bank first. The Tax Policy Centre estimates a sizeable increase in national debt, by almost 80 per cent [recently revised down to 50 per cent] of GDP over the next 20 years[v], with benefits most likely only for the highest income earners.

Moreover, notable economists including Larry Summers and Adam Posen have criticised the package for being “ill-designed”[vi], providing tax cuts which are likely to be “low-multiplier rather than high-multiplier and budget-busting rather than responsible”[vii]. Worse still, if these tax cuts are funded through cuts in more productive spending such as research & development or education, they could actually undermine growth.

Trump’s protectionist stance on trade would also drag on growth with severe implications for the global economy. Campaign promises of 45 and 35 percent import tariffs from China and Mexico could result in a trade war, and end up costing the US economy 4.8 million[viii] jobs, while tougher foreign investment rules could worsen the “global savings glut”. As the election campaign did not fail to shock and surprise, so developments across these areas continue to present both upside and downside risks, with some forecasters even predicting a recession by the start of 2018[ix].


Don’t forget the Fed

US equity markets, which once dived at the prospect of Hillary Clinton losing, have since rallied over the prospect of Trump’s fiscal expansion plans, while government yields continue rising with expectations of inflationary pressures to follow. With the US economy already close to the 2% inflation target and near full employment, there is a strong case for interest rate hikes starting in December. But as the Federal Reserve Chair Janet Yellen warned, a series of aggressive rate hikes could stall growth, pushing Trump’s doubling of growth target even further out of reach. Much of the success of any fiscal expansion will depend on multipliers and the associated monetary policy response (to be explored in an upcoming post), and as Yellen emphasised a great deal of uncertainty still surrounds the proposed economic policies. For now at least, ‘Trumponomics’ seems unlikely to be the solution to our secular stagnation problems.


References

[i] IMF World Economic Outlook, “Subdued Demand: Symptoms and Remedies”, October 2016

[ii] King, M., & Low, D., “Measuring the World Real Interest Rate”, NBER Working Paper w19887

[iii] Bernanke, B., “Why are interest rates so low, part 3: The Global Savings Glut”, Brookings, April 2015

[iv] Summers, L., “Reflections on the new ‘Secular Stagnation hypothesis”, VOXEU,  30 October 2014

[v] Nunns., J et al., “Analysis of Donald Trump’s Tax Plan”, Tax Policy Centre Research Report, December 2015

[vi] Gurdus, E., “Larry Summers: Trump’s economic plan is ‘ill-designed’ and harmful”, CNBC,  16th November 2016

[vii] Acton, G., “‘Trumponomics’ is unfunded, open-ended and kind of ridiculous, economist Adam Posen says”, CNBC, 16th November 2016

[viii]  Nolan, M., et al. “Assessing Trade Agendas in the US Presidential Campaign”, Peterson Institute for International Economics, September 2016

[ix] Zandi et al, “The Macroeconomic Consequences of Mr. Trump’s Economic Policies”, Moody’s Analytics, June 2016

Barcelona GSE Trobada: The Future of Europe Roundtable – Politics (3/3)

The Political Future of the European Union

By Giacomo Ponzetto

The next session moved on to the political economy of the EU. Professor Ponzetto started his presentation by sketching the classical theory of fiscal federalism that gives insights on both the current state of the EU and its future.

This theory boils down to the trade off between the benefits of policy coordination and the costs of policy uniformity: is there too much (for example many economists agree that the agricultural pact went too far; the same goes for monetary union with less consensus) or too little (since there is a monetary union, fiscal union needs to be achieved) coordination in the current European framework? The cost-benefit analysis becomes even trickier when the size of the union kicks in: with whom should we coordinate? Is the European Union overstretched, should it continue to expand to new countries? Over time a neoliberal consensus has emerged, embodied by the research work of Alberto Alesina (1999, 2005), pointing at a union that is too small and homogenous. This union has also seized the control of too many policies: this research tells us that any decision maker will take control of a policy whenever he has the possibility, whereas some policies would be best kept off limits as voters do not necessarily agree to delegate them. Furthermore, no matter it does too much or too little, the European Union is doing it wrong according to this neoliberal consensus: the single market is too little enforced, and so are the public goods (failure of coordination of foreign policy, defense); on the other side, it does way too much redistribution and local public services.

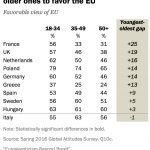
Professor Ponzetto highlighted two different scenarios for the future of Europe in the context of global economic integration. In the continuity of Brexit, the first possible outcome is that globalization renders the EU irrelevant, up to its dissolution, since its main realization, the single market, loses its competitive advantage with rising global trade. Here members no longer need to bear the cost of uniformity. On the contrary, it could also strengthen the European Union thanks to the very same single market. It could be the appropriate tool to take advantage of rising trade opportunities and common economic regulation that fosters economic integration as noted by Gancia, Ponzetto and Ventura (2016). In any case, Brexit may offer a natural experiment to check which of these scenarios is correct. Looking at qualitative data published by the Pew Research Center before the vote offers a mixed picture: the short term agreement on an “ever closer” union looks is a stretch, while it could change in the long term as younger adults are more likely to favour the EU.


Source: Euroskepticism Beyond Brexit, Pew Research Center, June 2016

The presentation then turned to the topic that really complicates European Union’s relation to voters: shared responsibility and political accountability. In practice, the EU has exclusive control on a very limited number of policies. Though a flexible combination of European and national responsibility seemed beneficial (Alesina, Angeloni and Etro, 2005), it also generated opacity and loss of accountability (Joanis, 2014): who is responsible for policy outcomes? This question enabled politicians to blame the European Union and holding it responsible for any policy failure. As such, a better enforcement of accountability through clear delegated monitoring would be welcome. Boffa, Piolatto and Ponzetto (2016) found that differences in government accountability (for example Germany versus Italy) make the union more desirable by helping countries converge to the best practices. Political economy also tells us that a fiscal union does not seem very likely to happen for two reasons highlighted by Persson and Tabellini (1996): moral hazard in local policy (higher risk taking); and the fact that risk sharing entails redistribution (not in theory but always in practice). It also provides some other insights on the hostility to immigration through three factors: labour-market competition (see Professor di Giovanni’s presentation), pressure on the welfare state and xenophobia.

Gazing into his crystal ball, Professor Ponzetto concluded his presentation by reminding us that the EU remains very cautious and does not aim at grand reform. On the positive side, the single market will probably go forward and continue to deepen, in particular for the European financial markets. On the negative side, he remarks that the current (and old) inefficiencies will probably continue for quite some time. Also, barring a significant shift in German politics, the fiscal doctrine is not likely to move from austerity to pro-competitive reforms.


References:

Alberto Alesina, Ignazio Angeloni, Federico Etro, 2005. “International Unions”, American Economic Review

Federico Boffa, Amedeo Piolatto & Giacomo A.M. Ponzetto, 2016. “Political Centralization and Government Accountability” Quarterly Journal of Economics

Marcelin Joanis, 2014. Shared Accountability and Partial Decentralization in Local Public Good Provision. Journal of Development Economics

Gino Gancia, Giacomo Ponzetto, Jaume Ventura, 2016. “Globalization and Political Structure”, NBER Working Paper No. 22046

Torsten Persson, Guido Tabellini, 1996. “Federal Fiscal Constitutions: Risk Sharing and Redistribution”, Journal of Political Economy

Bruce Stokes, Euroskepticism Beyond Brexit, Pew Research Center, June 7, 2016

Barcelona GSE Trobada: The Future of Europe Roundtable – Migration (2/3)

Migration in the EU and its economic impacts

By Julian di Giovani

Professor di Giovani continued the roundtable with a presentation on the theme of migration in the EU. He first articulated it around a thorough analysis of the current situation and the data. Even if inflows massively increased in 2015 due to the refugee crisis, migration in the EU is not not new and deals with various inflows coming from outside and inside the EU. Looking at historical data, migration to Europe has been a steady process since WWII and notably accelerated in 2006 after the significant extension of the European Union to ten countries, mostly in Eastern Europe.  Contrary to what is usually expected, the proportion of foreigners in 2014 was similar in the US and in the largest European countries.

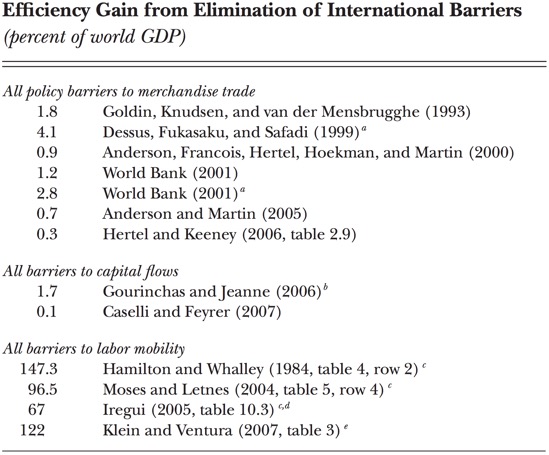
Research has been very active in breaking down and understanding the net economic impact of immigration, with an extensive literature on underlying economic variables. The first results from Borjas (1995) highlighted limited gains (to the tune of 0.1% of GDP) and even negative aggregate gains. Borjas found that overall gains were lower than net fiscal costs implying a transfer of wealth from nationals to immigrants. However, Borjas already added place for positive effects when the level of skills of immigrants was taken into account. Recent research has shown larger gains of immigration: Klein and Ventura (2007) through labour reallocation extension in a growth model; di Giovanni, Levchenko and Ortega (2015) in multicountry model that focuses on increased varieties and remittances. Another line of research summarized by Clemens (2011), noted that globalization was most successful in terms of economic gains with the mobility of the labour factor rather than that of capital and goods.

sans-titre

Source: “Economics and Emigration: Trillion-Dollar Bills on the Sidewalk?”, Clemens, M., Journal of Economic Perspectives, 2011

Ortega and Peri (2014) also found positive evidence in a cross-country analysis of income per person and predicted openness to migrants, with results driven by Total Factor Productivity due to diversity effects such as differentiated skills in labour force and increased innovation. Labour market outcomes are also addressed in de la Rica, Glitz and Ortega (2015) with the confirmation that migrants are more unemployed and paid less but also that countries are unequal in education level of their migrant populations. The direct question is then the distributional effects of these labour market outcomes for native workers. The first results are mixed: Borjas (2003) finds that immigration is responsible for large drop in unskilled wages in the US while Ottaviano and Peri (2012) establish the opposite in a model that allows imperfect substitution between immigrants and nationals with equal education and experience. Looking at the firm-level data in Germany, Dustmann and Glitz (2015) show that changes in the skill mix of local labor supply are mostly absorbed by adjustments within firms with changes in relative factor intensities as well as firms entering and exiting the market. Finally, net fiscal effects remain hard to estimate. Contrary to Borjas (1995), Dustmann and Frattini (2014) get a positive and substantial effect when exploiting micro data for the UK over 1995-2001.

Going forward, Professor di Giovanni insisted that migration is indeed a blessing for the European Union’s ageing population and can also facilitate the increase of female participation in the labour market. Innovative policy is of course needed but some solutions already exist, such as the EU Blue Card scheme for high-skills workers, and should be more developed to get results in the short run. But this also requires both institutional and social rigidities to be tackled as well as more resources: an appropriate policy reaction should go far beyond the migration issue only, which cannot be taken as an isolated issue.

References:

George J. Borjas, 1995. “The Economic Benefits from Immigration,” Journal of Economic Perspectives

George J. Borjas, 2003. “The Labor Demand Curve is Downward Sloping: Reexamining the Impact of Immigration on the Labor Market”, Quarterly of Journal Economics

Paul Klein, Gustavo J. Ventura, 2007. “TFP Differences and the Aggregate Effects of Labor Mobility in the Long Run” The B.E. Journal of Macroeconomics

Julian Giovanni & Andrei A. Levchenko & Francesc Ortega, 2015. “A Global View Of Cross-Border Migration,” Journal of the European Economic Association

Michael A. Clemens, 2011. “Economics and Emigration: Trillion-Dollar Bills on the Sidewalk?”, Journal of Economic Perspectives

Francesc Ortega, Giovanni Peri, 2014. “Openness and income: The roles of trade and migration”, Journal of International Economics

Gianmarco I. P. Ottaviano & Giovanni Peri, 2012. “Rethinking The Effect of Immigration On Wages,” Journal of the European Economic Association

Christian Dustmann & Albrecht Glitz, 2015. “How Do Industries and Firms Respond to Changes in Local Labor Supply?”, Journal of Labor Economics

Christian Dustmann & Tommaso Frattini, 2014. “The Fiscal Effects of Immigration to the UK”, Economic Journal