Can import promotion increase export performance in times of global value chains? Firm-level evidence from Russia

Master project by Deepshikha Deb, Nils Handler, Vladimir Peciar, Ksenia Proka, Juliane Stolle

Editor’s note: This post is part of a series showcasing Barcelona GSE master projects by students in the Class of 2018. The project is a required component of every master program.


Authors:

Deepshikha DebNils HandlerVladimir PeciarKsenia ProkaJuliane Stolle

Master’s Program:

International Trade, Finance, and Development

Paper Abstract:

This paper analyzes whether access to imported intermediate goods can raise export performance of Russian firms. We employ an instrumental variable strategy which exploits variation in firm-specific input tariffs to identify the effect of imported intermediates on firm exports during the period 2007-2013, utilizing a unique firm-level database on firm characteristics and customs declarations. We find that input tariff reductions can raise firm exports significantly, as can other measures aimed at increasing imports of intermediate goods of exporting firms in Russia. Import promotion targeted at exporting firms in high-tech sectors can be up to three times more effective. Better access to imports can also help increase the currently low share of exporting firms within the Russian enterprise landscape. Our results suggest that with the rising globalization and fragmentation of production processes, countries interested in raising exports need to think strategically of promoting imports as well. We propose and discuss several policy measures for Russia in the areas of tariff regulation, non- tariff measures, trade facilitation and trade integration.

Conclusions:

Using a comprehensive firm-level dataset which combines information on Russian company characteristics, involvement in trade and input tariff rates, we reveal a strong positive impact of intermediate imports on firm exports in the manufacturing sector. These results imply that improved access to intermediate goods at the international market can serve as a means to raise Russia’s currently weak export performance outside the natural resource sector. Import promotion policies targeted at intermediate goods imported by firms in high-tech sectors can be especially effective and raise exports by up to three times more than in other sectors. Better access to imports can also help increase the currently low share of exporting firms within the Russian enterprise landscape.

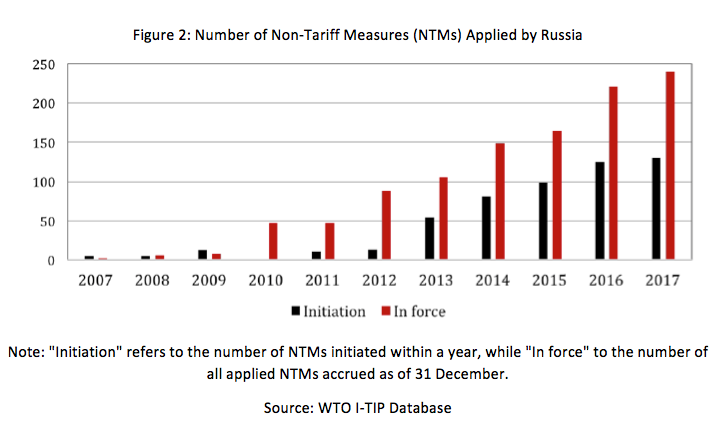
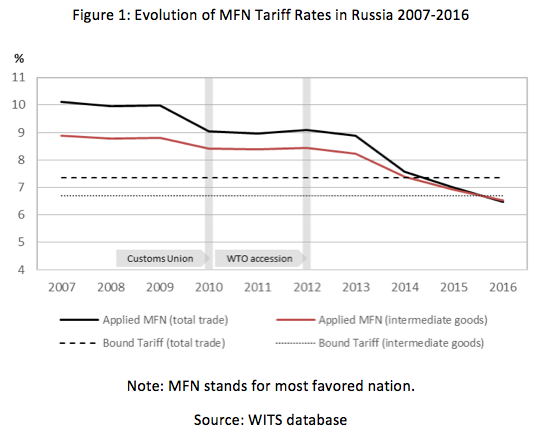
Our estimation results indicate that a one percentage point decrease in input tariffs would raise firm exports by approximately one percent. Even though tariffs have been significantly decreased over the past decade in the context of regional integration and Russia’s WTO accession (see figure 1), there is still ample room to lower input tariffs in order to promote exports. More than 40 percent of intermediate goods imported by Russian exporting manufacturing firms and more than 30 percent of goods imported by exporting firms in high-tech manufacturing sectors still entered the customs union at a tariff rate above 5 percent in 2015. Besides tariff reductions, Russia could consider lowering non-tariff measures (NTMs) and enhancing trade facilitation, which can also contribute to better access to intermediate goods of exporting firms, as suggested by our IV results. As can be seen from figure 2, NTMs have increased sharply since Russia joined the WTO in 2012. It should be pointed out, however, that trade policies aimed at promoting imports of intermediate goods alone will not be sufficient to boost non-oil export growth and export competitiveness of Russian firms. To bring the desired success, they need to be combined with a range of other important policies, including improving access of Russian exporters to foreign markets and simplifying the existing export regulation, as well as comprehensive structural reforms and measures to improve the business environment.

Key Figures:

figure figure

Download the full paper [pdf]


More about the ITFD Program at the Barcelona Graduate School of Economics

Barriers to Free-Trade: Is it only Trump?

 By Carl Christian Kontz (ITFD ’18)

As a European liberal and free-trade advocate, it has become quite entertaining to skim through social media, opinion pages, or listen to conversations about the latest tariffs imposed by the U.S. administration. One cannot help but wonder why a large fraction of Europeans, who just three years ago where protesting on the streets across all major European cities against the Transatlantic Trade and Investment Partnership (TTIP) and the infamous U.S. chlorinated chicken, are now the ones running their mouth about how “ignorant,” “stupid,” and “dangerous” Donald J. Trump’s decision to impose steel tariffs is. Surely, a lot of this has to be attributed to the very person associated with the tariff. It seems unlikely that people who regularly blame “neo-liberal” politics for the demise of literally everything are now in favor of a liberal stance on free trade and see a trade war as a threat to the welfare of the world.

Whatever one’s personal opinion about the 45th President of the United States is, we should acknowledge one thing: He is not alone in putting up trade barriers. Contrary to recent common belief, it’s not only Donald Trump who’s the biggest threat to increased welfare through global trade but also Argentina, Australia, Brazil, Canada, China, France, Germany, India, Indonesia, Italy, Japan, Mexico, Russia, Saudi Arabia, South Africa, South Korea, Turkey, the United Kingdom, the United States and the European Union. If you counted the latter, you already know where this is going: G20.

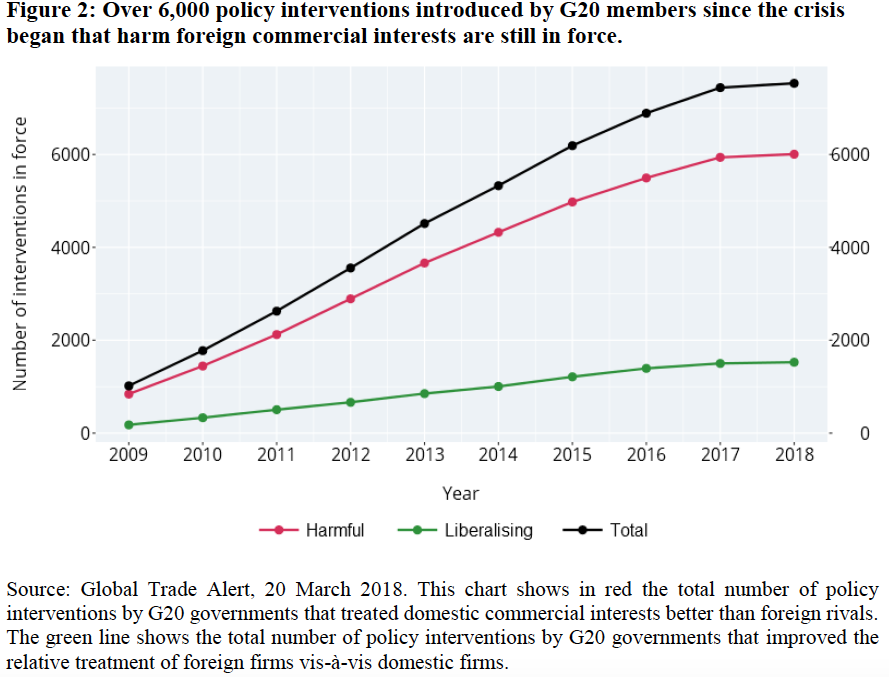
A recent policy brief addressed to the G20 members and their policymakers by Evenett[1] et al. (2018) shows this clearly. The policy brief states that over 6,000 interventions introduced by G20 members since the crises of 2009 that harm commercial interests are still in force. This is quite remarkable given the responses of the G7 members to the refusal of the United States to stand behind a common declaration of the recent sitting condemning protectionism. Moreover, it is in direct contradiction to the G20 summit declaration of 2008 and 2009, which posits that the G20 governments reject protectionism.

Further, the policy brief holds some uncomfortable truths for free-trade advocates as well as for globalization critiques. The former might be surprised by the extent to which trade barriers have grown since 2009, whereas the latter might be dazed by the consequences these barriers have on the least developed countries (LDCs).

Since the Great Recession and the financial crises of the late 2000s, trade barriers have risen sharply. Data gathered by Global Trader Alert, which has the most comprehensive coverage of all types of trade-discriminatory measures according to the IMF, indicates that a total of 200-250 new policies that harm foreign commercial interests have been implemented each quarter by G20 governments since November 2008. This amounts to a staggering 6,842 distortions to global commerce. It is imperative to emphasize that only 34% of them were outright import and export restrictions that a non-economist would normally think of when asked about trade barriers. Almost half of the trade distortions involve some type of state aid (e.g. subsidies, export incentives, and the like). Figure 2 of Evenett et al. (2018) summarizes this trend in the state of trade distortions by G20 members.

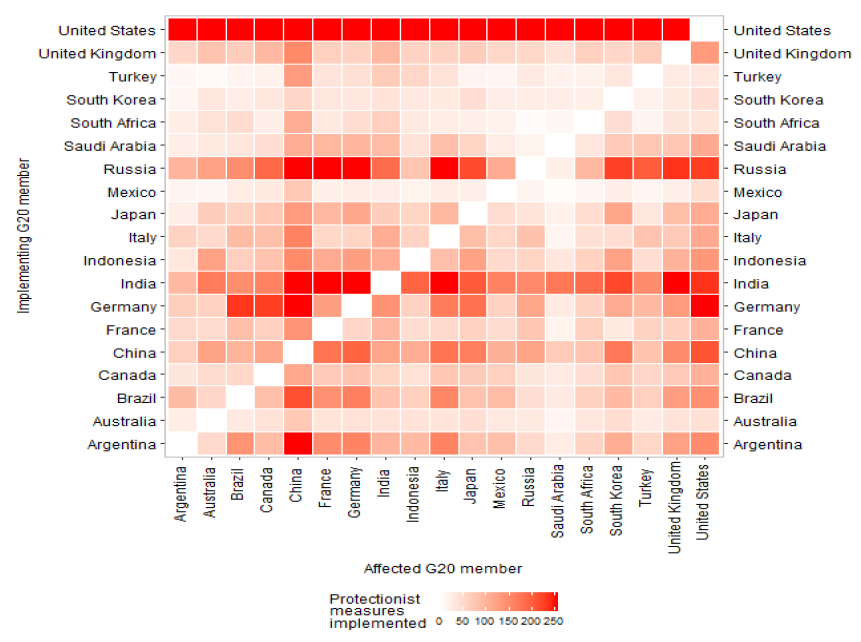
Notwithstanding, the picture of who imposes trade distortions is quite heterogeneous. Figure 3 of Evenett et al. (2018) gives an impressive graphical presentation of the reciprocal nature of the trade distortions of G20 members vis-á-vis each other. The heat map also unmasks one of Trumps notorious lies, or ignorance, i.e. that the United States is the “fair player” in global trade and that the world is cheating them. From the figure it is evident that since 2009 the U.S. has established a high number of protectionist measures across all G20 member countries, whereas only Germany, India, and Russia seem to have the same level of reciprocal measures against the U.S.. Poster children of free trade are emerging market economies like Turkey and South Africa, whereas the long-standing free-trade advocate United Kingdom is only somewhere in the upper third of free-traders. Unsurprisingly, the country which suffers the least from protectionist measures is Saudi Arabia, given its status as the world’s largest oil producer.

Using fine-grained UN trade data, the authors are able to identify to what extent these distortionary measures are affecting the export of goods of G20 members:

  • The percentage of G20 goods exports facing harmful policy acts has risen from 40% in 2009 to 80% in the first quarter of 2018.
  • Close to 9% of G20 goods exports compete in foreign markets where import tariffs have been raised.
  • Just under 19% of G20 exports compete in foreign markets against subsidies or bailed out domestic firms.
  • 75% of G20 exports now compete in foreign markets against foreign rivals that are eligible for some sort of state export incentive (mostly through incentives in the national tax systems).
  • 79% of LDC’s goods export compete in foreign markets against trade distortions implemented by G20 countries.

Where the final point should be emphasized. The trade distortions that LDCs face in exporting to G20 countries are also present in the competition on third country markets, further limiting the growth and development prospects of the poorest of the poor. Moreover, if the developed countries go ahead with this kind of policy and less developed countries adapt to this new state of the world by imposing trade distortions, we might end up in a bad equilibrium where less developed countries are excluded from global value chains.

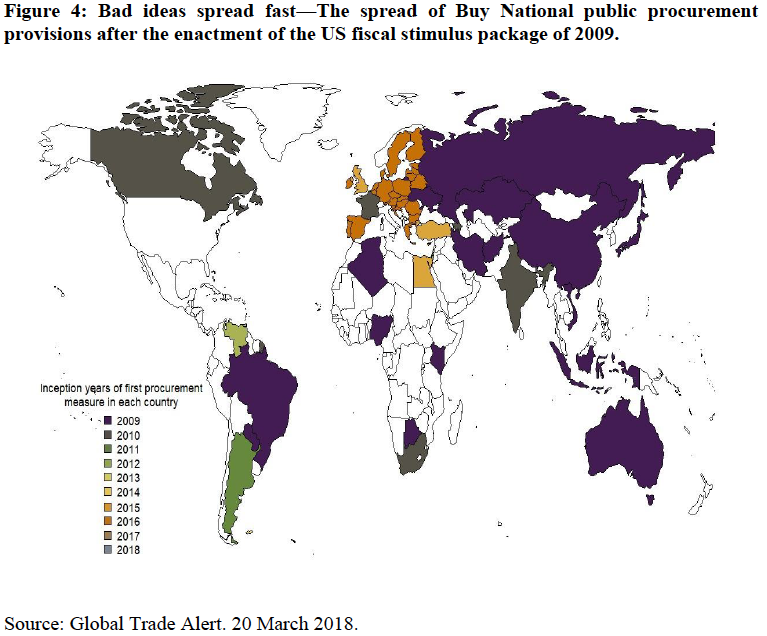
We actually see this already happening. In the wake of the financial crises, the U.S. whipped up a massive fiscal stimulus to help their economy (and ours!) recover. However, the stimulus package had a provision that demanded that public procurement should buy national, effectively putting up a huge barrier to import goods. Figure 4 of Evenett et al. (2018) shows how fast this idea spread around the world. Almost all of the other G20 countries followed suit and so did some developing countries. Policymakers might think this kind of procurement provision helps their national industries, however, they have to take into account that it also might have a negative effect on the government budget through higher prices, because domestic producers do not face international competition.

If we want globalization and trade to be inclusive and lead to sustainable growth and development even in the least fortunate parts of the world, we must acknowledge that the trade barriers the G20 put in place are detrimental to this effort.

The policy brief by Evenett et al. (which includes two proposals to reverse the dangerous path we are on) can be obtained here.


[1]Simon J. Evenett is Professor of International Trade and Economic Development at the University of St. Gallen, Switzerland, and Co-Director of the CEPR Programme in International Trade and Regional Economics. He gives Policy Lessons on the international trade systems to students in the ITFD programme.

Economics articles by BGSE alumni at CaixaBank Research

Ricard Murillo, Marta Guasch, and Mar Domènech in front of Caixabank. Photo by Marta Guasch.

We’ve just come across some articles written by several Barcelona GSE Alumni who are now Research Assistants and Economists at Caixabank Research in Barcelona. New articles are published each month on a range of topics.

Below is a list of all the alumni we found listed as article contributors, as well as their most recent publications in English (click each author to view his or her full list of articles in English, Catalan, and Spanish).

If you’re an alum and you’re also writing about Economics, let us know where we can find your stuff!

Gerard Arqué (Master’s in Macroeconomic Policy and Financial Markets ’09)

The (r)evolution in the regulatory and supervisory framework resulting from the crisis

Mar Domènech (Master’s in International Trade, Finance, and Development ’17)

Registered workers affiliated to Social Security: situation and outlook across sectors

Active labour market policies: a results-based evaluation

Equal opportunities: levelling the playing field for everyone

Cristina Farràs (Master’s in Macroeconomic Policy and Financial Markets ’17)

The financial situation of Millennial households in the US and Spain: will they catch up with previous generations?

Measures to improve equality of opportunities

Marta Guasch (Master’s in International Trade, Finance, and Development ’17)
and Adrià Morron (Master’s in Economics ’12)

Jay Gatsby’s American Dream: between inequality and social mobility

Ricard Murillo (Master’s in International Trade, Finance, and Development ’17)

Inflation will gradually recover in the euro area

Millenials and politics: mind the gap!

The sensitivity of inflation to the euro’s appreciation

Ariadna Vidal Martínez (Master’s in Finance ’12)

Situation and outlook for consumer financing


Source: Caixabank Research

How to do research and write about it.


 By Carl Christian Kontz (International Trade, Finance, and Development ’18)

As we are already in the third term and the time to write the analysis for our Master’s project approaches steadily, I thought it might be a good idea to share some resources about (economic) academic writing I came across over the last years.


John Cochrane of U Chicago, known for his contributions to financial macroeconomics and his blog The Grumpy Economist, provides us with a concise yet comprehensive guide on how to write a paper:


Another great resource covering nearly all issues of a (term) paper are the notes produced by Plamen Nikolov of Harvard University:


The most comprehensive guide on how to write economics I have come across during my undergraduate is by Robert Neugeboren and Mireille Jabocson of Harvard University. The guide outlines the economic approach, writing economically, the language of economic analysis, finding and researching your topic, as well as formatting and documentation.


Matthew Gentzkow (Stanford) and Jesse M. Shapiro (Brown) wrote a fantastic practitioner’s guide on how you should structure your code, why you should automate almost everything, and how important version control is. More general, the handbook is about translating insights from experts in code and data into practical terms for empirical social scientists. It’s a must-read for everyone working empirically.


Deidre McCloskey, another U Chicago household name, provides a deeper analysis of how an economist writes and thinks in her seminal works on the rhetoric of economics.


A great resource on how to communicate your research using data visualization is given by Jonathan A. Schwabish of The Urban Institute. Schwabish is considered a leader in the data visualization field and is a leading voice for clarity and accessibility in research.


Last but not least, the all-time classic by Berkeley’s Hal Varian on how to build an economic model.


Other useful resources are


Good general purpose books on writing, including organization and style, non-fiction books are


Strunk, White, and Angell – Elements of Style


William Zinsser – On Writing Well: The Classic Guide to Writing Nonfiction


Michael Billig – Learn to Write Badly: How to Succeed in the Social Sciences

Does tenure reduce incentives for high quality research?


By Carl Christian Kontz (International Trade, Finance, and Development ’18)


Economics is a very diverse field of social science with sub disciplines ranging from cultural economics, climate change economics, or sports economics to more traditional fields like trade theory or finance. A fascinating sub discipline, however, is economics itself.

In the following, I will give a brief summary of an interesting article recently published in the Journal of Economic Perspectives. In this contribution the researchers employ econometrics methods and economic theory to examine their own ecosystem.

But why would economists be interested in conducting research about their own profession? Colander (1989, p.1) provides some insight:

“The economics profession is interesting to economists for a number of interrelated reasons:

(1) For prurient and professional interest: It is fun to know about oneself and one’s profession.

(2) As a case study: If economic theory is correct, it should apply to the economics profession. Since economists have firsthand knowledge of the economics profession and relatively easy access to data, it makes an excellent case study.

(3) Because one has an interest in the sociology of knowledge: Recent developments in methodology and philosophy of science have made a knowledge of the scientists an important aspect of a knowledge of science; they are the lens through which science is interpreted. Understanding the tendency of scientists to aim that lens in particular directions and to distort the reality they are studying is necessary if one is to interpret their analyses correctly.”

In the current issue of the Journal of Economic Perspectives (JEP, Vol. 32, No. 1 – Winter 2018), Brogaard and company published an interesting contribution on the impact of tenure on research productivity. The authors examine whether the granting of tenure leads faculty to change their research and publishing behavior by using a sample of all academics who pass through top 50 U.S. economics and finance departments from 1996 through 2014. By using the extreme tails of ex-post citations as a measure of risk-taking in research, they find that both output of research and quality of output peak at the point where tenure is granted and decline thereafter. However, the opposite patterns hold true for the weak end of the tails with rising numbers after tenure. Using a subsample of academics at top 10 U.S. departments, the authors are able to show similar outcomes.

To obtain their results, the authors hand-collect a sample of employment and publishing data of academics at top 50 economics and finance departments in the United States. The sample encompasses the years from 1996 through 2014 and contains a total of 2,763 names, of whom 2,092 are eventually tenured at some point prior to 2014. Brogaard et al. (2018) consider two variables in the years before and after being granted tenure: the total number of publications, which serves as a measure of output; and the number of “home run” publications, meaning highly influential writings, as a measure of quality. By matching these names to publications in the 51 leadings journals in finance and economics, the authors are able to obtain their measure of output. The measure of quality, “home runs”, is defined as publications among the 10 percent’s most cited of all papers published in a given year.

Their findings indicate that both variables peak at the time tenure is granted and decline thereafter. The average output of annual publications by just tenured academics in economics declines by approximately 30 percent over the two subsequent years and further falls by an additional 15 percent over the next eight years. The average number of “home run’s” also falls by 30 percent over the two years after being granted tenure. Moreover, in the subsequent eight years it drops by another 35 percent. Given these findings, the authors calculate that the likelihood of a given publication to receive “home run” status declines by approximately 25 percent during the ten years following tenure.

Given their results, the authors set out to test different explanations which could have effects on the quantity and quality of tenured academics. Among those are:

  • Age effects the ability to produce top-rate tenure
  • Rise in non-research related work which is associated with becoming tenured
  • Tenured academics might branch out into our (sub) disciplines
  • Truly novel research may need time to gain momentum
  • Some schools may have poor tenure contracting

However, the authors test for those and claim that none of the explanations above seem likely given the data.

Brogaard et al. (2018) suggest two explanations which fit their general results: On the one hand, the decline in publication rates is coherent with the idea that tenure is granted once an academic has proven her merit through publishing success. On the other, tenure might reduce risk-taking behavior which leads to lower quality output. Overall, their findings indicate that “tenure is not providing incentives to undertake research in the same quantity and quality that led up to the tenure decision.” (p. 181).

In their conclusion the authors hasten to clarify that “[t]his paper should not be read as an indictment of the institution of tenure” (p. 192) as they only consider one aspect of tenure. Moreover, their work focusses on economics and finance only and cannot be generalized to other fields. However, they believe that their findings raise some practical questions for economic academia and it’s institutions (p.193):

“For economists, the findings suggest that they should be wary of allocating their research time in a way that seems likely to lead to low-impact papers, and instead consider if there is a way for them to continue their earlier research efforts—at least in terms of quality, if not necessarily in quantity. When making a tenure decision, departments of economics and their home institutions should be aware that the research productivity of the person receiving tenure is likely to decline, in both quantity and quality terms, over the following decade. Thus, institutions should consider whether there are methods to sustain (or at least not to impede) high-quality research efforts.”

The paper is available as a PDF using this link to the AEA website:

https://www.aeaweb.org/articles?id=10.1257/jep.32.1.179

Citations:

  1. Colander, David. 1989. “Research on the Economics Profession.” Journal of Economic Perspectives, 3(4): 137-148.
  2. Brogaard, Jonathan, Joseph Engelberg, and Edward Van Wesep. 2018. “Do Economists Swing for the Fences after Tenure?” Journal of Economic Perspectives, 32(1): 179-94.

The Web 2.0 in Nigeria: Evaluating the Impact of Increased Internet Access and Usage on Migration


By Roberta Sgariglia (International Trade, Finance, and Development ’18)


High speed internet and connectivity are among the main drivers of economic development in today’s information-intensive societies. Hence, in the context of the social sciences, increasing attention has been devoted to implications of technology adoption for traditional outcomes, such as migration, civic engagement and political participation, with particular emphasis on developing countries. As a matter of fact, numerous scholars argue that bridging the digital divide, hence fostering enhanced communication and ease of information access, has the potential to foster empowerment and beneficial innovation opportunities.

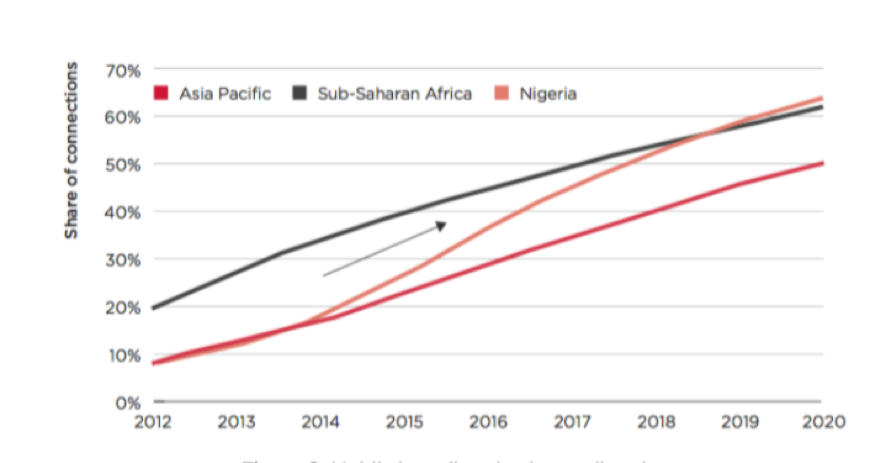
Therefore, this paper analyzes the impact of increased internet access on both internal and external migratory flows in Nigeria, where a national broadband expansion plan targeting existing infrastructure in urban areas was enacted in 2013. This effect is evaluated using two difference-in-difference estimations.

The first one assesses whether the policy was successful in enabling higher internet access rates. Convincing evidence was found to prove the effectiveness of the broadband expansion policy to date: in 2015, urban residents were approximately 7% more likely to have access to the internet on average, and these results are robust to different specifications.

The second estimation sets out to understand whether this effect triggered mobility and relocation. The analysis shows that there is a positive and significant effect in the order of 2%, robust to all specifications. However, the model’s explanatory power is low, as structural characteristics of the relevant sections of this dataset used pose significant limitations to the analyses and their potential for generalization. In any case, in the most basic form of the model, it appears that after the policy change urban residents were 1.5% more likely to move. This marginal impact becomes 1.9% once household fixed effects are accounted for. Finally, with respect to external migration probability, the overall significance of the model is not ascertained, so that even though increased internet access seems to have had a slightly negative effect on this outcome, we cannot safely conclude anything about this particular relationship.

As previously mentioned, results are hardly generalizable due to the structural limitations of the dataset, the lack of meaningful control variables and the mostly unexplored nature of migration dynamics in Nigeria.

Indeed, many of these setbacks arise from the relative scarcity or availability of surveys that include questions on information and communication technologies, particularly in developing countries. This in turn is due to the fact that data on mobile connectivity and other digital technology-related information is difficult to obtain, especially for rural communities. In this particular dataset the range of questions on the topic was very limited, which significantly narrowed the scope for the empirical analysis, and hampered the inclusion of meaningful control variables. Questions on mobility were also rather scarce, given that respondents were not directly asked about reasons for their decision: data on labor, education, health was collected in different sections and often could not be merged given that observations were not uniquely identified.

Consequently, the analysis started here can be meaningfully expanded and improved. Interesting extensions would explore the relationship between intrastate migration, a phenomenon which has only recently received the attention it requires, and internet usage: controlling for educational, health-related and employment decisions more accurately, it would be possible to better isolate the effect of internet access on migratory flows. In particular, it would be insightful to verify whether a causal relationship exists, perhaps by identifying a meaningful instrumental variable for this purpose. This would also shed light on whether determinants of internal migrations are actually comparable to those of external flows, as the literature seems to suggest. More specifically, the latter dynamics are largely unexplored in the specific context of Nigeria, and meaningful contributions could attempt to shed light on country-specific drivers of these migratory flows.

Finally, an interesting area of research which is somehow connected to the scope of this paper analyses the impact of digital technology on mobilization, both violent and peaceful, with important implications for policy making. Indeed, internet increases information availability and enhances communication, solving the collective action problem in some instances, while leading to secret coordination with anti-democratic objectives in others. Understanding through which channels, if any, mobilization works analogously to mobility, as well as which factors determine outcomes favorable to democratization rather than not is an extremely relevant question to answer.

Source: GSMA Intelligence

Mihai Patrulescu (ITFD ’10) on the rebalancing of Romanian markets

ITFD alum Mihai Patrulescu ’10 analyzes the Romanian market in an article for Emerging Europe.

“Over the past three years, the Romanian economy has recorded some of the fastest growth rates in the European Union, helped by a rapid expansion of consumer spending,” he writes. “During this period, retail sales have benefited from what can be considered as a perfect storm of growth catalysts.”

Read his full commentary on the Romanian economy on Emerging Europe

Mihai’s bio from Colliers International:

Mihai has joined Colliers International in October 2016 as Head of Strategic Analysis. Prior to this position, Mihai coordinated the economic research activities of UniCredit Romania, working for the bank between 2012 and 2016. During this period, he has focused on the Romanian economy as well as the CEE region, along with the banking system and financial markets. Prior to UniCredit, Mihai also worked as a research economist for Bancpost, the Romanian subsidiary of EFG Eurobank.

During 2015/2016, Mihai was seconded on assignment to the Milan Headquarters of UniCredit, working as a management consultant on the implementation of the bank’s strategic plan.

Mihai holds a Master’s in International Trade, Finance and Development from the Barcelona Graduate School of Economics. During his academic undertakings, he has focused on economic crises in emerging markets, and particularly their impact on financial systems. Mihai also holds a Bachelor degree from the Academy of Economic Studies in Bucharest.

Could post-Brexit uncertainty have been predicted?

By Cox Bogaards, Marceline Noumoe Feze, Swasti Gupta, Mia Kim Veloso

Almost a year since the UK voted to leave the EU, uncertainty still remains elevated with the UK’s Economic Policy Index at historical highs.  With Theresa May’s snap General Election in just under two weeks, the Labour party has narrowed the gap from Conservative lead to five percentage points, which combined with weak GDP data of only 0.2 per cent growth in Q1 2017 released yesterday, has driven the pound sterling to a three-week low against the dollar. Given potentially large repurcussions of market sentiment and financial market volatility on the economy as a whole, this series of events has further emphasised the the need for policymakers to implement effective forecasting models.

In this analysis, we contribute to ongoing research by assessing whether the uncertainty in the aftermath of the UK’s vote to leave the EU could have been predicted. Using the volatility of the Pound-Euro exchange rate as a measure of risk and uncertainty, we test the performance of one-step ahead forecast models including ARCH, GARCH and rolling variance in explaining the uncertainty that ensued in the aftermath of the Brexit vote.

Introduction

The UK’s referendum on EU membership is a prime example of an event which perpetuated financial market volatility and wider uncertainty.  On 20th February 2016, UK Prime Minister David Cameron announced the official referendum date on whether Britain should remain in the EU, and it was largely seen as one of the biggest political decisions made by the British government in decades.

Assessment by HM Treasury (2016) on the immediate impacts suggested “a vote to leave would cause an immediate and profound economic shock creating instability and uncertainty”, and in a severe shock scenario could see sterling effective exchange rate index depreciate by as much as 15 percent.  This was echoed in responses to the Centre for Macroeconomics’ (CFM) survey (25th February 2016), where 93 percent of respondents agreed that the possibility of the UK leaving the EU would lead to increased volatility in financial markets and the broader economy, expressing uncertainty about the post-Brexit world.

Resonating these views, the UK’s vote to leave the EU on 23rd June 2016 indeed led to significant currency impacts including GBP devaluation and greater volatility. On 27th June 2016, the Pound Sterling fell to $1.315, reaching a 31-year low against the dollar since 1985 and below the value of the Pound’s “Black Wednesday” value in 1992 when the UK left the ERM.

In this analysis, we assess whether the uncertainty in the aftermath of the UK’s vote to leave the EU could have been predicted. Using the volatility of Pound-Euro exchange rate as a measure of risk and uncertainty, we test the performance of one-step ahead forecast models including ARCH, GARCH and rolling variance. We conduct an out-of-sample forecast based on models using daily data pre-announcement (from 1st January 2010 until 19th February 2016) and test performance against the actual data from 22nd February 2016 to 28th February 2017.

Descriptive Statistics and Dynamic Properties

As can be seen in Figure 1, the value of the Pound exhibits a general upward trend against the Euro over the majority of our sample. The series peaks at the start of 2016, and begins a sharp downtrend afterwards.  There are several noticeable movements in the exchange rate, which can be traced back to key events, and we can also comment on the volatility of exchange rate returns surrounding these events, as a proxy for the level of uncertainty, shown in Figure 2.

Figure 1: GBP/EUR Exchange Rate

Fig 1

Source: Sveriges Riksbank and authors’ calculations

Notably, over our sample, the pound reached its lowest level against the Euro at €1.10 in March 2010, amid pressure from the European Commission on the UK government to cut spending, along with a bearish housing market in England and Wales. The Pound was still recovering from the recent financial crisis in which it was severely affected during which it almost reached parity with the Euro at €1.02 in December 2008 – its lowest recorded value since the Euro’s inception (Kollewe 2008).

However, from the second half of 2011 the Pound began rising against the Euro, as the Eurozone debt crisis began to unfold. After some fears over a new recession due to consistently weak industrial output, by July 2015 the pound hit a seven and a half year high against the Euro at 1.44.   Volatility over this period remained relatively low, except in the run up to the UK General elections in early 2015.

However, Britain’s vote to leave the EU on 23rd June 2016 raised investors’ concerns about the economic prospects of the UK. In the next 24 hours, the Pound depreciated by 1.5 per cent on the immediate news of the exit vote and by a further 5.5 per cent over the weekend that followed, causing volatility to spike to new record levels as can be seen in Figure 2.

Figure 2: Volatility of GBP/EUR Exchange Rate

fig 2

Source: Sveriges Riksbank and authors’ calculations

As seen in Figure 1, the GBP-EUR exchange rate series is trending for majority of the sample, and this may reflect non-stationarity in which case standard asymptotic theory would be violated, resulting in infinitely persistent shocks. We conduct an Augmented Dickey Fuller test on the exchange rate and find evidence of non-stationarity, and proceed by creating daily log returns in order to de-trend the series. Table 1 summarises the first four moments of the log daily returns series, which is stationary.

Table 1: Summary Statistics

Table 1.PNG

Source: Sveriges Riksbank and authors’ calculations

The series has a mean close to zero, suggesting that on average the Pound neither appreciates or depreciates against the Euro on a daily basis. There is a slight negative skew and significant kurtosis – almost five times higher than that of the normal distribution of three – as depicted in the kernel density plot below. This suggests that the distribution of daily returns for the GBP-EUR, like many financial time series, exhibits fat tails, i.e. it exhibits a higher probability of extreme changes than the normal distribution, as would be expected.

To determine whether there is any dependence in our series, we assess the autocorrelation in the returns. Carrying out a Ljung-Box test using 22 lags, as this corresponds to a month of daily data, we cannot reject the null of no autocorrelation in the returns series, which is confirmed by an inspection of the autocorrelograms. While we find no evidence of dependence in the returns series, we find strong autocorrelations in the absolute and squared returns.

The non-significant ACF and PACF of returns, but significant ACFs of absolute and squared returns indicate that the series exhibits ARCH effects. This suggests that the variance of returns is changing over time, and there may be volatility clustering. To test this, we conduct an ARCH-LM test using four lag returns and find that the F-statistic is significant at the 0.05 level.

Estimation

For the in-sample analysis we proceed using the Box-Jenkins methodology. Given the evidence of ARCH effects and volatility clustering using an ARCH-LM test but lack of any leverage effects in line with economic theory, we proceed to estimate models which can capture this: ARCH (1), ARCH (2), and the GARCH (1,1).  Estimation of ARCH (1) suggests low persistence as captured by α1 and relatively fast mean reversion. The ARCH(2) model generates greater persistence measured by sum of α1 and α2 and but still not as large as the GARCH(1,1) model, sum of  α1 and β as shown in table 2.

Table 2: Parameter Estimates
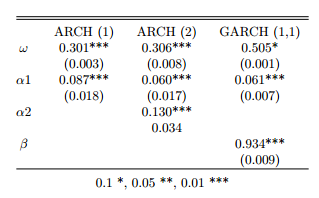
table 2

We proceed to forecast using the ARCH(1) as it has the lowest AIC and BIC in-sample, and GARCH (1,1) which has the most normally distributed residuals, no dependence in absolute levels, and the largest log-likelihood. We compare performance against a baseline 5 day rolling variance model.

Figure 3 plots the out of sample forecasts of the three models (from 22nd February 2016 to 28th February 2017). The ARCH model is able to capture the spike in volatility surrounding the referendum, however the shock does not persist. In contrast, the effect of this shock in the GARCH model fades more slowly suggesting that uncertainty persists for a longer time. However neither of the models fully capture the magnitude of the spike in volatility. This is in line with Dukich et al’s (2010) and Miletic’s (2014) findings that GARCH models are not able to adequately capture the sudden shifts in volatility associated with shocks.

Figure 3: Volatility forecasts and Squared Returns (5-day Rolling window)
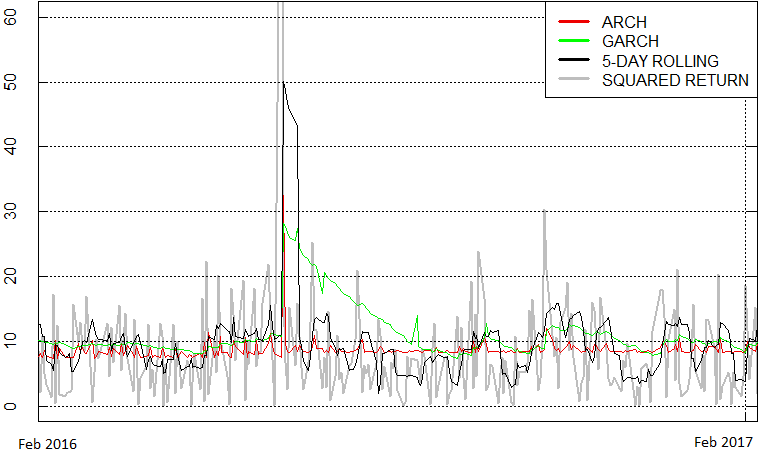
Fig 3

We use two losses traditionally used in the volatility forecasting literature namely the quasi-likelihood (QL) loss and the mean-squared error (MSE) loss. QL depends only on the multiplicative forecast error, whereas the MSE depends only on the additive forecast error. Among the two losses, QL is often more recommended as MSE has a bias that is proportional to the square of the true variance, while the bias of QL is independent of the volatility level. As shown in table 3, GARCH(1,1) has the lowest QL, while the ARCH (1) and rolling variance perform better on the MSE measure.

Table 3: QL & MSE

Table 3 QL and MSE

Table 4: Diebold- Mariano Test (w/5-day Rolling window)
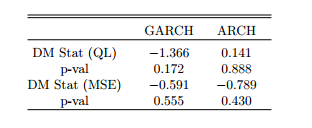
Table 4 DM test

Employing the Diebold-Mariano (DM) Test, we find that there is no significance in the DM statistics of both the QL and MSE. Neither the GARCH nor ARCH are found to perform significantly better than the 5-day Rolling Variance.

Conclusion

In this analysis, we tested various models to forecast the volatility of the Pound exchange rate against the Euro in light of the Brexit referendum. In line with Miletić (2014), we find that despite accounting for volatility clustering through ARCH effects, our models do not fully capture volatility during periods of extremely high uncertainty.

We find that the shock to the exchange rate resulted in a large but temporary swing in volatility but this did not persist as long as predicted by the GARCH model. In contrast, the ARCH model has a very low persistence, and while it captures the temporary spike in volatility well, it quickly reverts to the unconditional mean.  To the extent that we can consider exchange rate volatility as a measure of risk and uncertainty, we may have expected the outcome of Brexit to have a long term effect on uncertainty. However, we observe that the exchange rate volatility after Brexit does not seem significantly higher than before. This may suggest that either uncertainty does not persist (unlikely) or that the Pound-Euro exchange rate volatility does not capture fully the uncertainty surrounding the future of the UK outside the EU.

References

Abdalla S.Z.S (2012), “Modelling Exchange Rate Volatility using GARCH Models: Empirical Evidence from Arab Countries”, International Journal of Economics and Finance, 4(3), 216-229

Allen K.and Monaghan A. “Brexit Fallout – the Economic Impact in Six Key Charts.” www.theguardian.com. Guardian News and Media Limited, 8 Jul. 2016. Web. Accessed: March 11, 2017

Brownlees C., Engle R., and Kelly B. (2011), “A Practical Guide to Volatility Forecasting Through Calm and Storm”, The Journal of Risk, 14(2), 3-22.

Centre for Macroeconomics (2016), “Brexit and Financial Market Volatility”. Accessed: March 9, 2017.

Cox, J. (2017) “Pound sterling falls after Labour slashes Tory lead in latest election poll”, independent.co.uk. Web. Accessed May 26, 2017

Diebold F. X. (2013), “Comparing Predictive Accuracy, Twenty Years Later: A Personal Perspective on the Use and Abuse of Diebold-Mariano Tests”. Dukich J., Kim K.Y., and Lin H.H. (2010), “Modeling Exchange Rates using the GARCH Model”

HM Treasury (2016), “HM Treasury analysis: the immediate economic impact of leaving the EU”, published 23rd May 2016.

Sveriges Riksbank, “Cross Rates” www.riksbank.se. Web. Accessed 16 Feb 2017

Taylor, A. and Taylor, M. (2004), “The Purchasing Power Parity Debate”, Journal of Economic Perspectives, 18(4), 135-158.

Van Dijk, D., and Franses P.H. (2003), “Selecting a Nonlinear Time Series Model Using Weighted Tests of Equal Forecast Accuracy”, Oxford Bulletin of Economics and Statistics, 65, 727–44.

Tani, S. (2017), “Asian companies muddle through Brexit uncertainty” asia.nikkei.com. Web. Accessed: May 26, 2017
Alum Charlie Thompson (ITFD ’14) uses data science to build a virtual Coachella experience

ITFD alum Charlie Thompson ’14 is an R enthusiast who enjoys “tapping into interesting data sets and creating interactive tools and visualizations.”

image credit: musichistoryingifs.com

ITFD alum Charlie Thompson ’14 is an R enthusiast who enjoys “tapping into interesting data sets and creating interactive tools and visualizations.” His latest blog post explains how he used cluster analysis to build a Coachella playlist on Spotify:

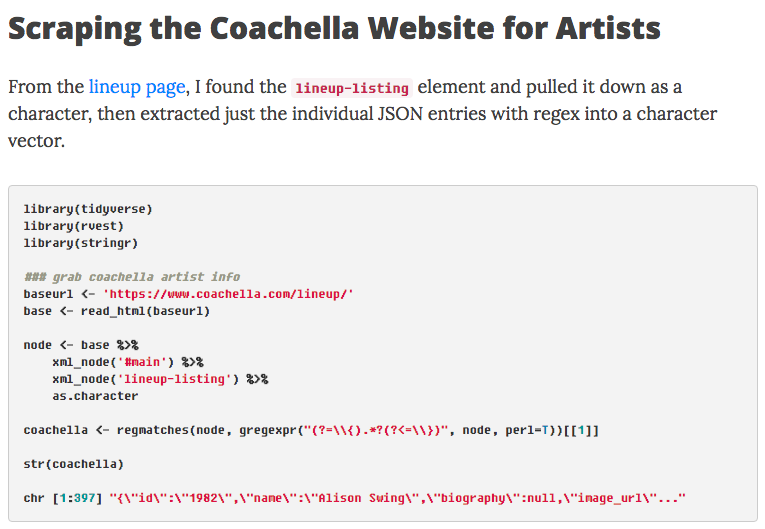
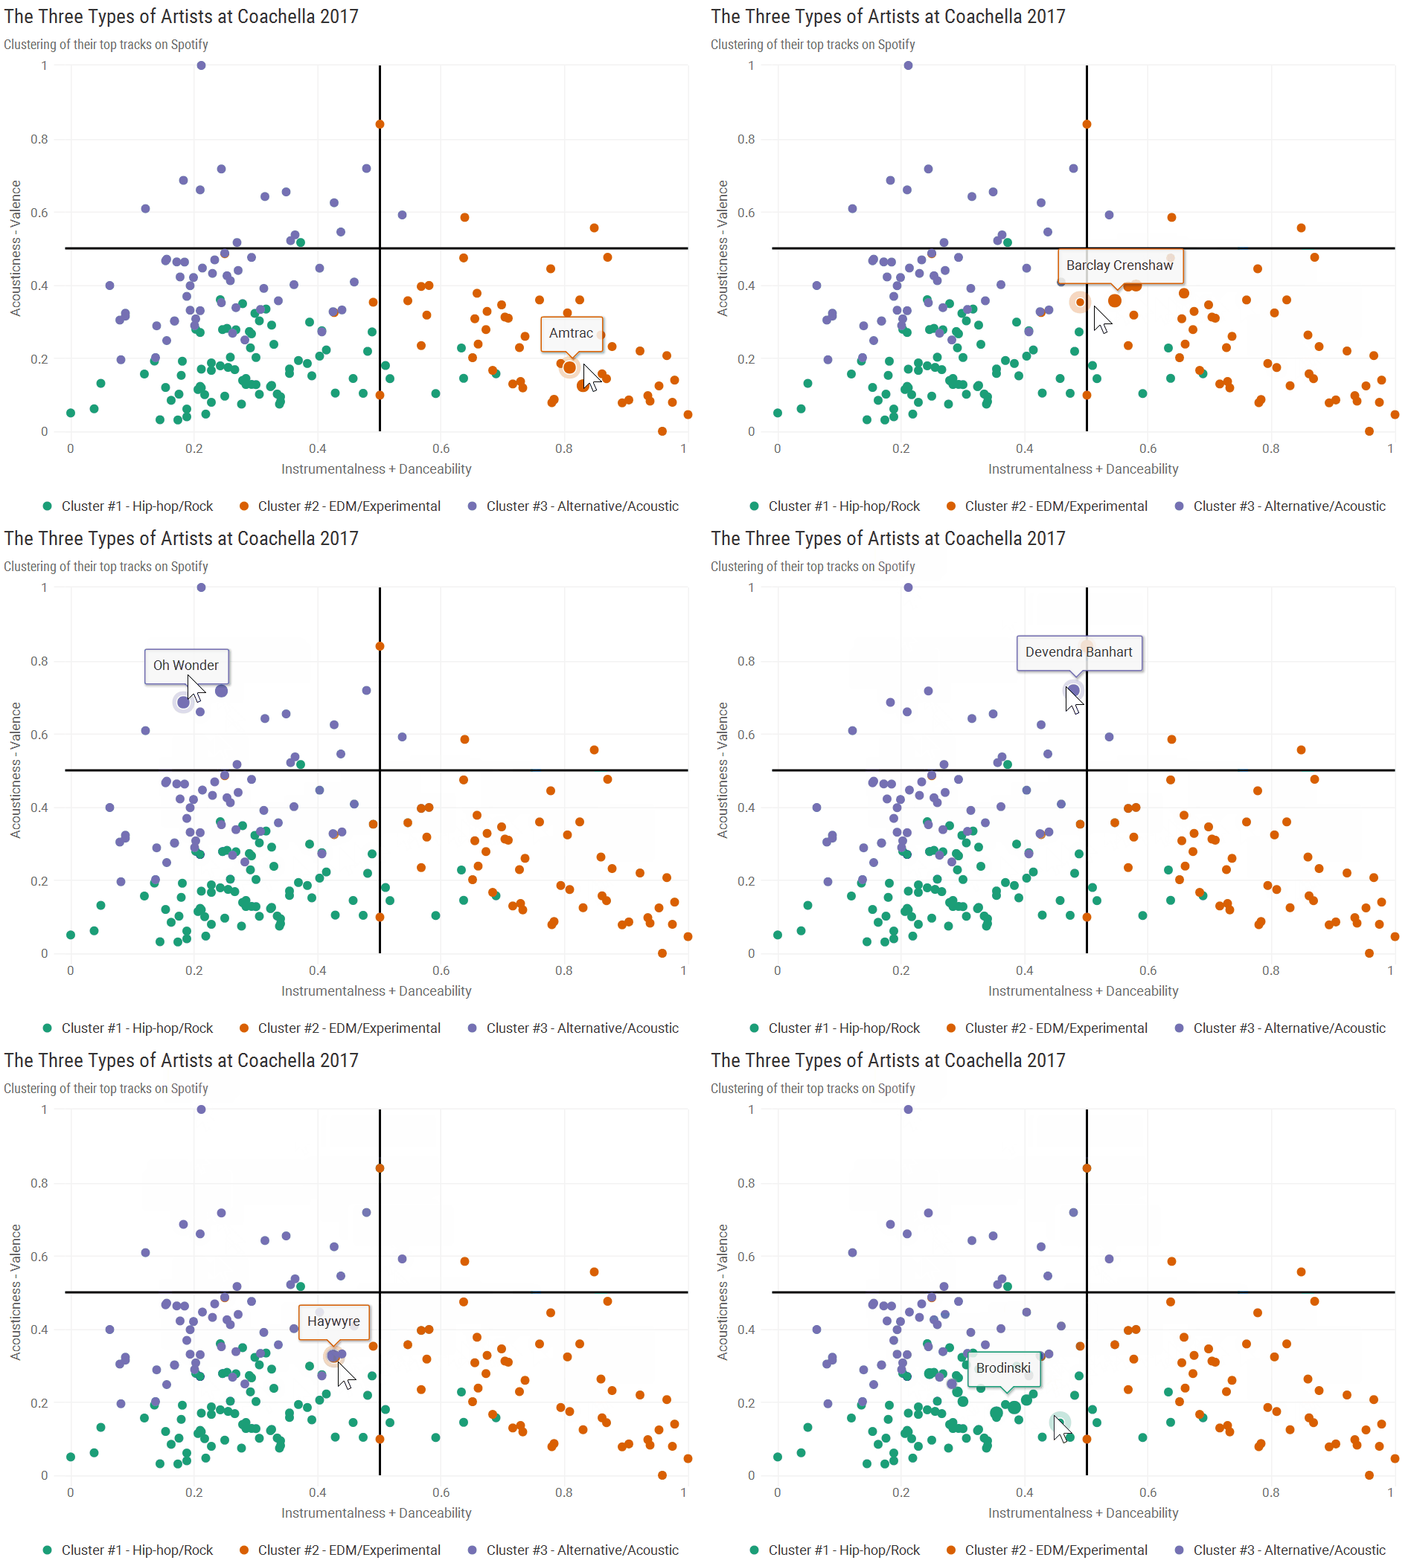
“Coachella kicks off today, but since I’m not lucky enough to head off into the California desert this year, I did the next best thing: used R to scrape the lineup from the festival’s website and cluster the attending artists based on audio features of their top ten Spotify tracks!”

source: Charlie Thompson


source: Charlie Thompson

Read the full blog post on his website

Charlie shares a bit of his background on his website:

Currently an Analytics Specialist at a tech startup called VideoBlocks, I create models of online customer behavior and manage our A/B testing infrastructure. I previously worked as a Senior Data Analyst for Booz Allen Hamilton, where I developed immigration forecasts for the Department of Homeland Security. I also built RShiny applications for various clients to visualize trends in global disease detection, explore NFL play calling, and cluster MLB pitchers. After grad school I worked as a Research Assistant in the Macroeconomics Department of Banc Sabadell in Spain, measuring price bubbles in the Colombian housing market.

I have an MS in International Trade, Finance, and Development from the Barcelona Graduate School of Economics and a BS in Economics from Gonzaga University. For my Master’s thesis I drafted a policy proposal on primary education reform in Argentina, using cluster analysis to determine the optimal regions to implement the program. I also conducted research in behavioral economics and experimental design, using original surveys and statistical modelling to estimate framing effects and the maximization of employee effort.

Read more about Charlie on his website

The True Cost of Polarization

“There’s No Such Thing as a Free Lunch” – Milton Friedman

In their first lesson of economics, students are introduced to the concept of scarcity – an inherent condition in a world of limited resources – and, as a result, the existence of opportunity costs; Milton Friedman’s famous quote “There’s No Such Thing as a Free Lunch” echoes this idea that everything has a cost, even when it is not obvious. When it comes to government decisions, costs are often scrutinized: the cost of an investment, of giving (or not giving) a public service in concession or implementing a policy; however, the costs of political polarization are rarely analyzed.

What is the cost of political polarization?

Or, rather, which is the most valued asset lost for having political polarization? Certainty. In this essay, the author will provide arguments in favor of the hypothesis that the opportunity cost of the increasing gap between political attitudes of politicians towards major policy dimensions (trade, migration, gender, racial integration, public expenditure) is uncertainty and will discuss its negative effects on economic performance.

A first approach to studying the economic effects of uncertainty resulting from political activities is observing economic markets’ performance during electoral cycles. Brandon and Youngsuk (2012) estimated the effect of elections over corporate investment. Results indicate that, after setting control variables for investment opportunities and economic environment variables, corporate investment rates dropped, on average, by 4.8 percentage points the year prior to elections. In countries with polarization, the effect is expected to increase due to the risk of abrupt changes in policy. The changes may be moderate, for example: contract regulations, taxation, trade policy, or more drastic actions like expropriation of possessions and hostility towards non-supporters. Empirical evidence reveals that political polarization affects investment not only during electoral cycles, but also discourages long-term investments, with investors instead opting  to minimize their risk and making short-term opportunistic solutions such as  asset stripping, and intensive lobbying with state officials (Frye. 2002).

Other negative effects of polarization

Especially in countries with parties that exhibit diverging ideologies such as ex-communists and anticommunists, other negative effects of polarization are the imposed barriers to create consensus. There is a constant conflict over the economic reforms to be implemented, given the conflicting principles, and it does not allow politicians to reach agreements to effectively address economic crisis with coherent policies (Frye. 2002).

The struggle between opposing factions also has a detrimental effect on  the quality of institutions by increasing the state officials’ incentives to make opportunistic decisions, for example populism, clientelistic relationships, bribing and interference of power groups in government policies, just to name a few

According to a growing mass of literature on the subject, when a country lacks strong institutions and has a polarized government, it will be more likely to default on sovereign debt. It is important to bear in mind that sovereign debt crises   do not occur only when governments choose to default, as recent events have shown that crises can arise from investor’s uncertainty about a country’s ability or intentions to honor its responsibilities. Qian (2012) uses an economic model to show the dynamics between the quality of institutions, the level of government polarization and the sovereign default risk, for a sample of 90 countries. Her findings support the premise that the lack of strong institutions and a clear set of rules allows powerful groups to capture government and influence policies to their benefit, without considering their impact on other groups.

Additional evidence of the negative effects of polarization and weak institutions is found when combined with a globalized financial market. In particular, countries with low income and weak institutions are perceived as unreliable by investors and experience a threshold effect that will hinder their access to all the benefits of globalization, as presented by Alfaro, Kalemli-Ozcan and Volosovych (2008), as well as by Kose, Prasad and Taylor (2011).

Moreover, Broner and Ventura (2006) discuss the conditions under which globalization lead to higher financial market volatility. According to their model, the instability of domestic financial markets can be explained by: 1) uncertainty of governments’ behavior (incentives to default on foreign liabilities increased with globalization) and 2) the probability of a financial crisis (i.e., it depends largely on the nature of regulations and strength of judicial systems to enforce contracts). As a result of financial liberalization and the existence of the previously mentioned sources of uncertainty, the economy will alternate between two possible outcomes: an optimistic equilibrium (in which institutions are strong in enforcing contracts) or a pessimistic equilibrium (one with weak, opportunistic institutions). In a polarized government, the effect of the uncertainty sources would be amplified, potentially destroying the possibility of an optimistic equilibrium.

After analyzing polarized countries using these arguments, it is not a surprise to find that some countries have low levels of investment, slow economic growth, high volatility and recurring economic and institutional crises.

 “There’s No Such Thing as a Free Lunch”… especially when it comes from a politician.

References

Layman, G. C., Carsey, T. M., & Horowitz, J. M. (2006). Party polarization in American politics: Characteristics, causes, and consequences. Annu. Rev. Polit. Sci., 9, 83-110.

Baldassarri, D., & Bearman, P. (2007). Dynamics of political polarization. American sociological review, 72(5), 784-811.

 Qian, Rong. 2012. Why Do Some Countries Default More Often Than Others? The Role of Institutions. Policy Research working paper; no. WPS 5993. World Bank. © World Bank.

Frye, Timothy. 2002. The Perils of Polarization: Economic Performance in the Postcommunist World. World Politics, Volume 54, Number 3, April 2002, pp. 308-337

Brandon. J, Youngsuk, Y. 2012. Political Uncertainty and Corporate Investment Cycles. Journal of Finance, 67 (2012), 45-83.

Broner, F. and Ventura, J., 2006. Rethinking the effects of financial globalization. The Quarterly Journal of Economics, p.qjw010.

Corporación Latinbarómetro, Socio- demographic variables (2015). Retrieved from http://www.latinobarometro.org/latOnline.jsp