Brexit: BGSE Community Analysis

We want to know what the BGSE community is thinking and reading about the Brexit.

brexit-624x437

We invite all Barcelona GSE students and alumni to share their early reflections on the potential economic consequences of the UK’s recent vote to leave the EU. Did you focus on a related topic in your master project? Are you working at a think tank, central bank, or consulting firm where your projects will be impacted by this decision? Have you seen any articles or links that you found useful for understanding what lies ahead?

Here are a couple of pieces we’ve found to get the discussion going:

After Brexit: What next for the EMU, EU and UK?
(ADEMU webinar)

The BGSE participates in A Dynamic Economic and Monetary Union (ADEMU), a project of the EU Horizon 2020 Program. Last week, ADEMU researchers held a webinar to discuss the Brexit.

Background:

Europe has grown out of its crises when reason and solidarity have prevailed, but it has also been devastated by its crises when fear and nationalism have taken the lead. Brexit, in the aftermath of the euro crisis, brings this dichotomy back to the foreground. Since 2010 there have been important advances in the development of the Economic and Monetary Union (EMU) and flexible forms of participation have allowed other EU countries, reluctant to join the euro, to share the basic principles that define the EU and have a common presence in the interdependent global world.

According to the panelists, Brexit raises 3 crucial questions:

  1. Should the EMU be accelerated to become a centre of gravity within the EU, or slowed down to avoid a centrifugal diaspora? If accelerated, how?
  2. Should an ‘exit’ country be allowed free entry to the single market and other EU public goods without accepting freedom of movement?
  3. Should the EU remain as it is, or increase its capacity to offer common public services (Banking Union, border security, research funding, environment, etc.), or limit its scope of activity to the EU single and integrated market?

Webinar Panel:
– Joaquín Almunia (Former Vice-President of the European Commission, honorary president of the Barcelona GSE)
– Ramon Marimon (European University Institute and UPF – Barcelona GSE; ADEMU)
– Gorgio Monti (European University Institute; ADEMU)
– Morten Ravn (University College London; ADEMU)

Moderator:
Annika Zorn (European University Institute; Florence School of Banking & Finance)


From Brexit to the Future
(Joseph Stiglitz)

Nobel Laureate and Barcelona GSE Scientific Council member Joseph Stiglitz shares some reflections in the wake of the Brexit decision


What are you thoughts on Brexit?

We want to know what the BGSE community is thinking and reading about the Brexit. Please share your ideas, favorite sources for analysis, or observations from economists you respect in the comments below.

Industrial game over: can low-income countries grow through services rather than industry?

alumniMarco Antonielli ’12 (International Trade, Finance, and Development) is a consultant with Nathan Associates in London. Prior to this he was a consultant at the OECD in Paris and a research assistant at the Bruegel think tank in Brussels. The following piece by Marco originally appeared on Nathan’s website. (All opinion and analysis are only those of the author.)

Follow Marco on Twitter @AntonielliM and read his blog.


In a global economy with fewer opportunities to industrialize, low-income countries will need to embed the service sector in their vision for inclusive growth.

Amid a gloomy global economic outlook and crashing commodity prices, low-income countries ended 2015 with the slowest growth since 2009, and remain in serious need of new sources of inclusive growth. One major challenge to achieving higher living standards stems from the vast income and productivity gaps within these countries and in relation to the rest of the world.

Large-scale industrialization has traditionally been viewed as the main solution for bridging these gaps, as well as a strategic objective to create jobs and support future growth. Yet latecomers to development may have embarked on a path on which manufacturing—arguably the most promising sector—is expanding slowly in absolute terms, and often shrinking in relation to GDP. The questions are then: why do low-income countries struggle to industrialize? And could alternative sectors such as services replace manufacturing as engines of inclusive growth?

Growing out of the Traditional Economy

Let’s take a step back. While all economies are characterized by varying degrees of productivity and dynamism among sectors and businesses, the low-income countries feature tremendous structural gaps within their economies. Most of the workforce is employed in informal and traditional agricultural businesses, while manufacturing is limited and not fully organized and the dynamic services are largely confined to the cities. Also the modern and formal agricultural businesses are not as widespread as they could be.

To escape poverty, millions of workers need to move from low-productivity sectors and businesses, mainly agriculture, to high-productivity ones, where they will find better and more secure jobs. The reallocation of resources to modern and dynamic sectors can generate positive transformation and help low-income countries achieve inclusive growth.

However, economic transformation can lead to labor and capital being reallocated to more inefficient activities. Recent studies have found that from a macroeconomic perspective, structural transformation (i.e., intersectoral movement of resources) can be a drag on growth for long periods of time, and this is part of the reason why the growth dynamics of low- and middle-income countries have been so diverse. Such a pattern is illustrated in figure 1. Observing the breakdown (“decomposition”) of aggregate productivity growth in the sum of sectoral components and a component accounting for cross-sectoral labor reallocation, it can be noted that between the 1990s and the 2010s Asian and Eastern European countries benefited from the structural transformation of their economies, while Latin American and Sub-Saharan African countries had the opposite experience. Developing countries are therefore not necessarily transforming well over their growth paths.

Figure 1—Decomposition of aggregate productivity growth, 1990–2008
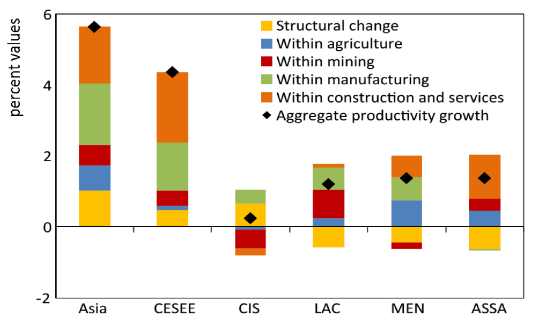
Figure 1

Source: Dabla-Norris et al. (2014)

CESEE: Central, Eastern and Southeastern Europe; CIS: Commonwealth of Independent States; LAC: Latin America and the Caribbean; MENA: Middle East and North Africa; SSA: Sub-Saharan Africa

Organized and modern manufacturing is commonly understood as the business where workers in informal or more traditional forms of agriculture should be reemployed. This is because, while manufacturing is not necessarily the most efficient sector in the economy, it can be a growth accelerator and engine of inclusive growth for at least three reasons. First, manufacturers in emerging economies can benefit from manufacturing technologies developed in more advanced countries, and can achieve fast productivity growth. Second, manufacturing can absorb unskilled labor—thus providing improved employment opportunities for agricultural workers in low-income countries. Finally, manufacturers can export their products, so their growth will not be confined by limited domestic demand. Tradability is key, because high productivity growth can quickly lead producers to lower their prices and shed labor and capital if they cannot scale up their sales in bigger markets.

Is Industrialization a Broken Engine?

Virtually all successful emerging economies in the past 30 years have industrialized by leveraging this potential. Manufacturing offers opportunities to diversify away from agricultural and other traditional products, and helps the country pull itself out of poverty. But is this growth trajectory still feasible for today’s developing countries?

In most countries, the share of jobs and GDP arising from manufacturing expands in the early stages of development, then peaks and starts shrinking as relative prices decline and the economy matures. As Dani Rodrik and others have recently argued, latecomers to development in Africa and Latin America are hitting the peak earlier in the process, and are starting to deindustrialize when manufacturing has exploited only part of its potential. Ghani and O’Connell, for example, explore this inverted-U relationship between the level of economic development and the industry’s share of total employment, in a panel of 100 countries. They show how, in recent times, jobs in industry have grown more slowly and shrunk earlier in the development process (figure 2). The engine of industrialization seems to be running out of steam.

According to Rodrik, this manufacturing decline is mainly due to the adverse effects of trade and globalization on low- and middle-income countries in Africa and Latin America in two respects. First, these countries struggle in the international goods market because of a decline in the relative price of manufacturing in advanced economies, where technological progress has pushed up efficiency and reduced the need for expensive labor. Second, low transport costs and low trade barriers expose them to hyper-cheap production from East Asia, effectively reducing the scope for “import substitution” to expand the boost in manufacturing exports to the wider economy. This would suggest that today’s low-income countries will need to wait until East Asia becomes expensive before they industrialize.

A competing theory is that the low-income countries have subscribed to a trade system that is altogether unfavorable to them. On the one hand, to get access to international markets they are required to forgo protectionist policies that foster import substitution and screen nascent industries from foreign competition during their early development (see e.g., Ha-Joon Chang). On the other hand, trade barriers to advanced markets like the EU are set low for raw materials such as coffee beans and cocoa pods but high for the products obtained from processing of materials—in these examples, roasted coffee and chocolate. This means that the entry points to industrialization of commodity-dependent countries are essentially shut down.

Figure 2—Is Industrialization Running out of Steam?

Figure 2

Source: Ghani and O’Connell (2014) with World Bank data

Help Services

Both theories offer plausible explanations of why low-income countries struggle to industrialize. While more evidence on the causes of the problem is needed, it is increasingly clear that vast-scale industrialization has not featured in the development of most low-income countries. In contrast, the service sector has grown rapidly and absorbed lots of labor. Looking at Sub-Saharan Africa, for example, in the 15 years of this century . This pattern does not adequately represent how low-income countries grow and expand their productive capabilities, at least in that it does not capture the role of the variety and complexity of the products menu offered by these countries. Yet it can raise the question of how services can replace manufacturing as an engine of inclusive development. At least three routes can be identified.

First, there is a fringe of dynamic and tradable services that can boost the economy just as manufacturing does. Banking, customer services, and communications are examples of services which the ICT revolution has opened up to trade, and which can take low-income countries on a growth escalator, as the Indian boom has demonstrated. Crucially, investments in infrastructure, education, and human capital need to be made to facilitate development in these services. An alternative service attracting foreign demand with decent labor-absorption capacity is tourism.

Second, services are crucial inputs to manufacturing and there is evidence that their importance is growing. Hence cheap and efficient services such as transport and telecommunications can translate into stronger competitiveness of the tradable sector—both manufacturing and services.

Finally, the fact that manufacturing and services are becoming increasingly “blurred,” with services activities making up a higher share of manufacturing output, means that low-income countries could exploit a competitive edge on relevant service tasks. Moreover, these tasks can often be unbundled from merchandise production and traded along the global value chain. Logistics, marketing and post-sales services have been on the rise, not only in developed economies but also in developing ones. Furthermore, this trend could lead to a misinterpretation of statistics based on obsolete sector categories, effectively misleading our understanding of structural change.

In sum, the service sector offers new and interesting opportunities for growth, both through tradable services that plug directly into the global economy and through services that support competitiveness of manufacturing. In a global economy with fewer opportunities to industrialize, low-income countries will need to embed the service sector in their vision of inclusive growth and focus on the conditions that enable these opportunities.

Many thanks to my colleagues Joe Holden and Ignacio Fiestas for their helpful comments. This blog first appeared at: http://www.nathaninc.com/news/industrial-game-over-can-low-income-countries-grow-through-services-rather-industry 

Economic Effects of Catalan Independence: A Historical and Theoretical Perspective

ITFD students organized a talk on the economic effects of Catalan independence with Prof. Jaume Ventura.

By Ben Beuchel ’16, Frederik Møller Jensen ’16, and Saskia Mösle ’16, students in the International Trade, Finance, and Development master’s program


Why are so many Catalans advocating independence? What would be the economic consequences of a potential separation from Spain? To find answers, BGSE students from the Master’s Program International Trade, Finance, and Development organized a talk on the economic effects of Catalan independence with Prof. Jaume Ventura. Prof. Ventura is a senior researcher at the Centre de Recerca en Economia Internacional (CREI), research professor at Barcelona GSE and member of the Wilson Initiative, a pro-Catalan-independence association of academics in the fields of economics and political science.

What is the optimal size of a state?

From a theoretical viewpoint, the ‘right’ size of a state is determined by a trade-off between two opposing forces. On the one hand, economies of scale and the border effect (i.e. political borders hamper trade) create a force towards larger countries. Such benefits are especially pronounced in areas such as economic markets and defense. On the other hand, heterogeneity of people’s preferences with respect to culture, the legal system or welfare, embodies a force for smaller countries. According to Prof. Ventura, these two forces have shaped the size and structure of the state in two waves throughout the history of globalization.

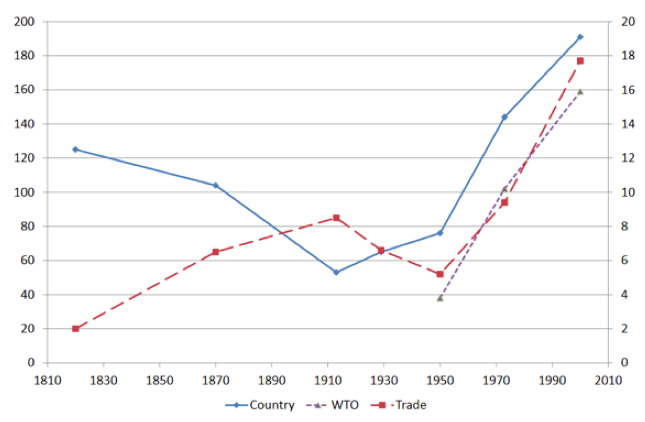
In the first wave, spanning from the Congress of Vienna to the beginning of the First World War, the number of countries more than halved, implying that states, on average, became larger. Political and economic integration proceeded hand in hand, and larger markets were created by sacrificing heterogeneity of preferences. After the Second World War, the second wave of globalization began. International trade reached higher levels and the number of countries multiplied to over 190. At the same time, international collaboration in the form of international organizations, such as the World Trade Organization, emerged. While this new era was characterized by political fragmentation regarding the nation state, larger markets were created through international cooperation and sacrificing economies of scope.

Figure 1
Figure 1. Trade share (right axis), the number of countries and WTO membership (left axis). Source: Gancia, Ponzetto, Ventura (2016).

The creation of supra-national organizations enabled countries to exploit economies of scale irrespective of their size. As supra-national entities took over functions such as defense, which had previously mandated a larger state, even small states were able to thrive. At the same time, competencies such as culture, law and order and the welfare state remained on national agendas, as cultural globalization proceeds more slowly than economic globalization. All in all, it seems that the homogeneity of constituents’ preferences has become a more decisive determinant of a country’s size in the second wave of globalization.

The Catalan perspective

With this theoretical background in mind, Prof. Ventura turned to the specific case of Catalonia. First, he argued that small states in Europe, such as Norway and Switzerland, are competitive and wealthy. A potential Catalonian state with 7.5 million inhabitants would be larger than Denmark, Norway and Ireland, and only slightly smaller than Switzerland. Studies also find that the effect of size on economic growth depends on the degree of openness (Alesina, Spolaore and Wacziarg 2005). If a country is very open, size seems to have negative effects on growth. Catalonia, with a high degree of openness of 130%, could thus potentially grow faster if independent from Spain.

Next, Prof. Ventura focused on the long-run economic benefits of independence. If Catalonia became independent, this would imply giving up economies of scale arising from the union with Spain. However, these costs remain limited, in his opinion. The fixed costs of running a Catalan state have been generously estimated to be €2.793m which represents 1.4% of Catalan GDP, or €383 per Catalan citizen. Additionally, markets and defense have already been outsourced to the EU and NATO, suggesting that Catalonia would not lose out if it gave up the union with Spain (provided that it remained a member of EU and NATO). A major benefit for the Catalan economy would be the stop of fiscal transfers to the rest of Spain. Currently, taxes paid to the central government exceed public spending in Catalonia by €16.409m (8.4% of GDP). Moreover, current public capital in the region is the lowest throughout Spain. Public investment in Catalonia accounted for merely 8-9% of Spanish public spending, even though Catalonia contributes roughly 20% to the Spanish GDP.

In the short-run, there is a chance that costs might arise from retaliation by the Spanish state, and maybe others. However, Prof. Ventura estimates such costs, e.g. commercial boycotts, to be small and short-lived. He argues that retaliation would not be a sub-game perfect outcome, as most of the EU’s foreign investments and trade with Spain flows through Catalonia.

While the potential economic gains are substantial, Prof. Ventura emphasized that the heterogeneity of preferences between Catalonia and the rest of Spain remains the key reason behind Catalonia’s longing for independence. He pointed to his experience in the U.S., where the states enjoy a high degree of autonomy regarding education, justice, infrastructure, welfare and culture. In contrast, Spain’s central government dominates most aspects of public policy and previous attempts to increase Catalonia’s autonomy within Spain have failed.

While the future of Catalonia remains uncertain, Prof. Ventura advocated the right to self-determination and believes that “Catalan independence offers a unique window of opportunity to reform a bankrupt state and adapt it to modern times, both in Catalonia and Spain”.

References

  1. Gancia, G. A., Ponzetto, G. A., & Ventura, J. (2016). Globalization and Political Structure. NBER Working Paper No. 22046.
  2. Alesina, A., Spolaore, E., & Wacziarg, R. (2005). Trade, Growth and the Size of Countries. Handbook of Economic Growth, 1499-1542.

Special talk for master’s students by Justin Yifu Lin on “New Structural Economics”

authorLecture summary by Tuomas Kari ’16 (Master’s in International Trade, Finance, and Development)


The former Chief Economist of the World Bank and member of Barcelona GSE Scientific Council Justin Yifu Lin visited Barcelona GSE on May 2nd to give a special talk to the Master students on a new approach to development policy, titled “New Structural Economics: The Third Wave of Development Thinking”. Professor Lin, who currently teaches at the National School of Development at the University of Beijing, outlined the history of development economics and its shortcomings. The goal of the lecture was to derive lessons for optimal policy and then expand upon the idea of new structural economics, the approach Prof. Lin himself advocates.

Structuralism and neoliberalism

Prof. Lin divided the history of development into two time periods: structuralism that was dominant from 1950 to the 1980s, and neoliberalism that has been the main viewpoint up to this day. Structuralism tended to assume that there were market failures that needed to be corrected with industrial policy, such as import substitution. The failure of these policies is well documented as the government-subsidized industries rarely survived at global markets and distorted the countries’ economies. Neoliberalist reaction emphasized deregulation to rid the economy of rent seeking and liberalization to let markets determine the allocation of resources. But this too failed in developing countries to reach steady growth. Often, liberalization led to the collapse of entire sectors, high unemployment and subsequent political unrest.

The main exception to these consensus policies throughout the last half a century have been the East Asian Tigers, Hong Kong, Singapore, South Korea and Taiwan, countries that followed a dual track of capitalist and state-directed policies and achieved unmatched growth rates. As these countries were initially too poor to afford expensive subsidies to heavy industry, they promoted production lower in the value chain, and even then only by piece-meal measures. According to Prof. Lin, this lack of better options guided the Tigers to good policies by accident.

photo
Professor Lin delivered the Barcelona GSE Lecture at Banc Sabadell later the same day to the entire BGSE community.

Economic growth as a result of structural transformation

New structural economics is an attempt to study the determinants of economic structure and its evolution using neoclassical methods. Prof. Lin starts from the hypothesis that economic structure is endogenous to the country’s endowments and optimal policy guides the economy to activities where it enjoys comparative advantage. If a country attempts to transform its economy to activities other than those that utilize its endowments, this will only result in distortions, breaking down of market mechanisms and rent seeking. Optimal policy must start from the development of endowments (capital stock, human capital etc.) and only after try to deal with the production structure. As economic growth is ultimately a result of structural transformation, Prof. Lin argued that governments must engage in first building up the necessary endowments and then using industrial policy to help firms enter into business.

The preconditions for economic growth are having a functioning market economy efficiently allocate resources across sectors and firms, and a facilitating state that provides transitional support for firms entering and exiting the market and liberalizing the economy gradually using discretion. Lin claimed would lead to competitiveness, openness to trade, and strong fiscal and external accounts, which allow the economy to avoid crises and engage in countercyclical policies. Another benefit would be high returns to investment that provide incentives to save.

Room for more economic research

Prof. Lin promoted the setting up of Special Economic Zones to allow firms to do business free from distortions and also work as laboratories for the government to see what the comparative advantages of the economy are. He ended the lecture by proposing the development of theoretical models capable of explaining these dynamics as a fruitful avenue for the future economists in the audience.

Brazil: from boom to bust?

Post by Facundo Abraham ’16 and Alberto González de Aledo Pérez ’16, current master’s students in the Barcelona GSE International Trade, Finance, and Development Program.


In 2001 it was widely predicted that in a decade’s time, Brazil, Russia, India and China (dubbed the BRICs) would become leading economies in the world, reshaping the global economy and international institutions. Now, more than a decade later, with the BRICs economies slowing down, these countries have lost momentum and there is doubt whether the BRICs’ will actually take over the world economy. The most paradoxical case is perhaps Brazil. Once seen as the country of the future and put forward as an example of economic success, it has now sunk into recession, high inflation and corruption scandals. So, what happened to Brazil? How did the country go from being the pampered child of international investors to a pariah in just a decade? What we argue is that when the figures are examined, they reveal that since 2001 the economic performance of Brazil was far from spectacular and, in fact, rather disappointing. Thus, the negative shift in expectations towards Brazil should come as no surprise.

We will focus on a simple growth accounting exercise. Simply stated, we assume that output in an economy is produced under a Cobb-Douglas production function in which capital and labour are used as inputs together under a certain technology/productivity. Mathematically:

equation

Then, to eliminate the effect of country size on output, we can define output per worker as:

equation

In this way, we can see that growth can be derived from two sources: technological progress and capital accumulation such that:

equation

Did Brazil keep up pace with the other BRICs?

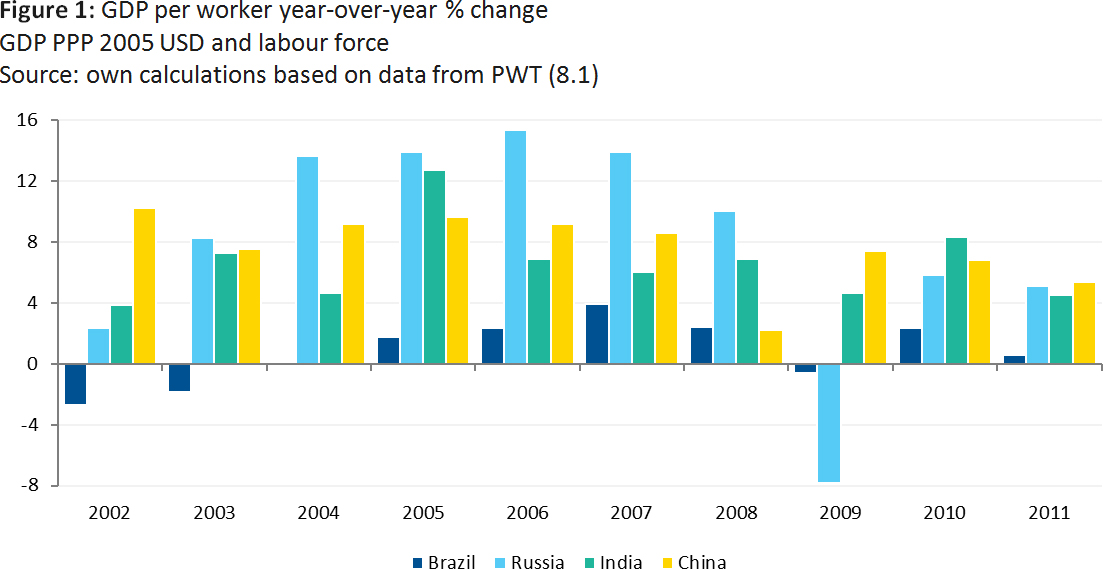
The first question we need to answer is whether Brazil was experiencing high growth rates like the rest of the BRICs. The data shows that after 2001, the economy of Brazil lagged behind the other BRIC countries. Between 2002 and 2011 output per worker grew on average only 1.2%, far behind the 8.5% in Russia, 7.3% in China and 6.9% in India. Comparing the growth rates year by year clearly shows the sluggish performance of Brazil among the BRICs.

figure

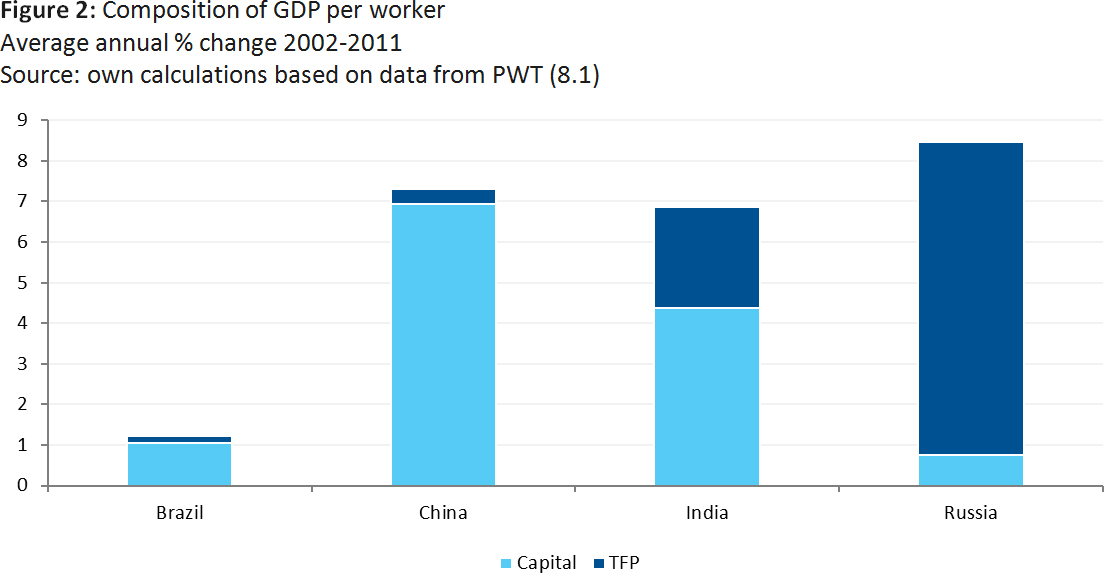
Going further, we can ask ourselves how did Brazil perform related to capital accumulation and productivity growth. In the period 2002-2011 capital accumulation in Brazil was low with the capital per worker ratio growing on average by 2.3%. This figure is far less than the 11.4% in China and 8.6% in India. Yes, Brazil did better than Russia where the ratio increased by 1.9% yearly. However, Russia beat Brazil by far in productivity growth. While in Russia productivity grew on average 7.7% per year, in Brazil it grew by only 0.2%. Brazil was the BRIC country with lowest productivity growth being also behind India (2.5%) and China (0.4%).

figure 2

But was Brazil doing better than before?

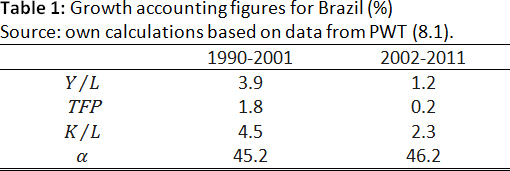
Even though Brazil could have been doing worse than the rest of the BRICs, maybe Brazil was experiencing an economic boom compared to the previous years, which motivated the positive change in investor sentiment. However, again the data shows that Brazil performed worse since 2001 than in the 90s. Between 1990 and 2001 the Brazilian output per worker grew at 3.9% on average per year, with capital per worker growing at 4.5% and productivity at 1.8%. As shown below, these figures are better than the ones from 2002 onwards.

table

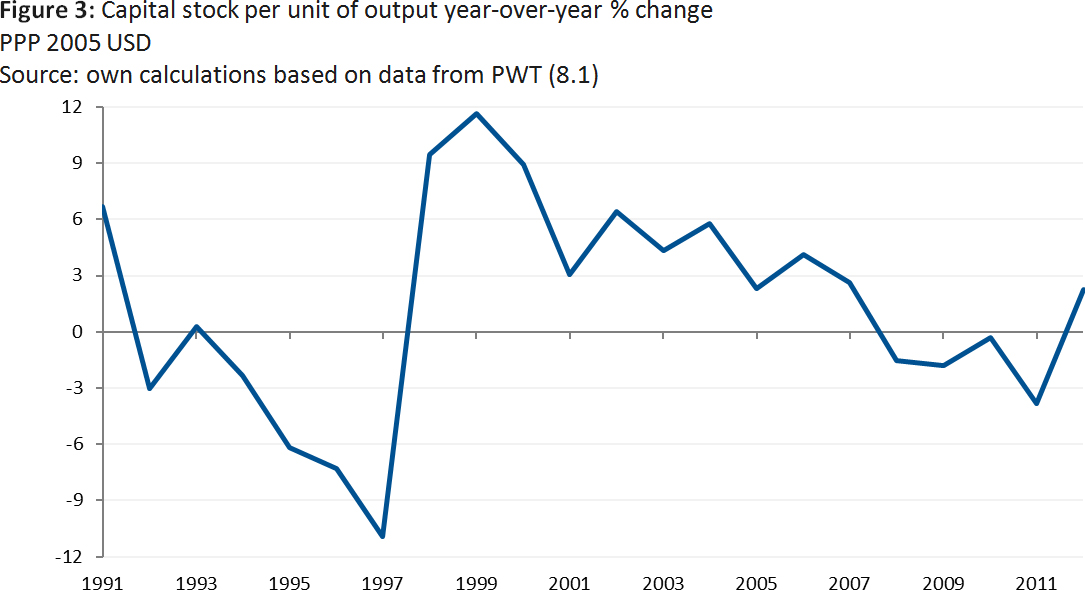
An interesting observation comes from analysing the capital intensity ratio, measured as capital stock over output. In the growth literature, as an economy moves towards its steady state, the growth rate of the capital to output ratio diminishes and eventually becomes zero in the steady state. Thus, the growth rate of capital to output is called “transitional growth” while the growth rate of productivity is the long-term growth. Looking at the data, the growth of the capital intensity ratio in Brazil dropped over recent years, being near to zero. This behaviour is more consistent with an economy that is exhausting its growth rather than with an economy entering a period of high growth.

figure 3

More Latin American, less BRIC

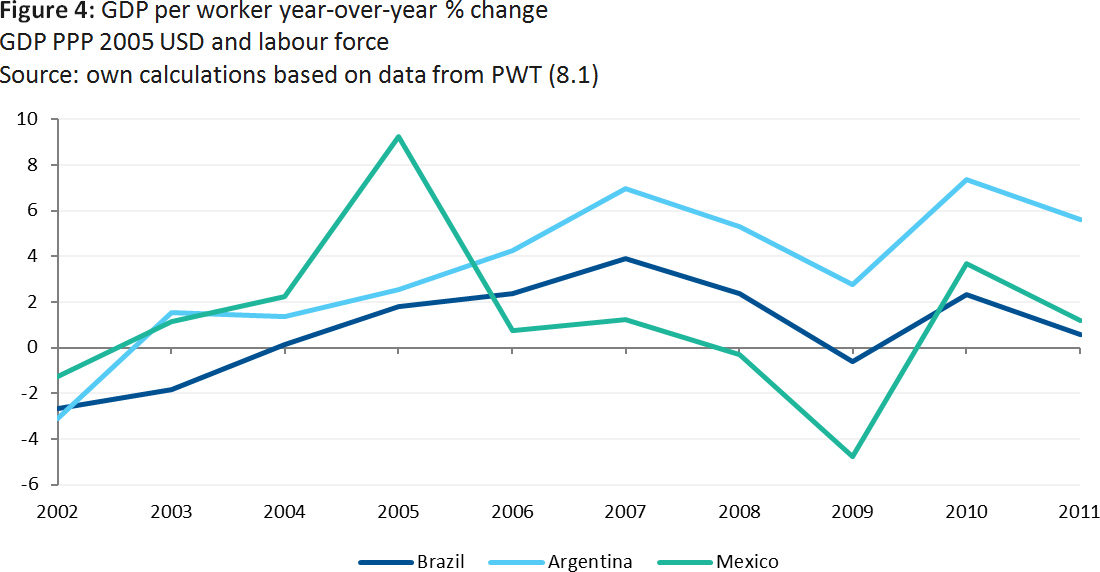
A final analysis consists in comparing the economic performance of Brazil to the other two big Latin American economies: Argentina and Mexico. Brazil’s output per worker growth of 1.2% per year was less than the 4.2% in Argentina and 1.5% in Mexico. In addition, comparing the growth rates for each year shows that the behaviour of the three economies was very similar and, moreover, Brazil performed worse than Argentina.

figure 4

This simple comparison could support the view that Brazil does not seem to have behaved like the other BRICs, being closer in performance to its Latin American neighbours. This observation is important considering that while Brazil was a star in the international markets, Mexico and Argentina were viewed with far more pessimism.

Concluding remarks

This growth accounting exercise is useful in providing simple insights that help us understand more clearly what has happened to Brazil over the last decade. There are many reasons behind the rise and fall of the Brazilian economy and it is not the aim of this article to account for them all. The results are enlightening because they show that, after being included in the BRICs and brought into the spotlight of financial markets, Brazil’s economic performance was modest compared to the other BRIC countries and even to its own past performance. Thus, even before the start of the crisis, the Brazilian economy showed some weaknesses that should have raised red flags early on.

About the authors

FacundoFacundo is a current student at the International Trade, Finance and Development program. Previously he worked in consulting projects on financial regulation and supervision in Latin America. He graduated in Economics from Universidad Torcuato di Tella. Connect with Facundo on Linkedin.


Alberto Alberto is a current student at the International Trade, Finance and Development program. He is a former Economist in BBVA’s Economic Research Department. He holds a BSc in Economics from Universidad Carlos III de Madrid. Connect with Alberto on Linkedin or follow him on Twitter.
The link between export diversification and economic growth

This empirical exercise examines how export diversification is related with higher GDP per capita growth.

Post by Facundo Abraham ’16 and Alberto González de Aledo Pérez ’16, current master’s students in the Barcelona GSE International Trade, Finance, and Development Program.

The diversification of exports exemplifies the transition of economies towards higher levels of development with more complex economic structures. It can also facilitate risk reallocation and mitigate negative terms of trade shocks in a certain industry or geographical area. In addition, countries exposed to international competition can benefit from better ways of doing business.

This empirical exercise examines how export diversification is related with higher GDP per capita growth. For the most part it follows the dynamic panel data model proposed in Hesse (2008) for a sample of seven Asian emerging markets and developing economies. The author illustrates that these countries are considered to be a cluster characterised by both high degrees of export diversification and GDP per capita growth in the long run. The exercise updates the calculations made for this sample.

Model specification and data

The augmented version of the Solow growth model provides the necessary framework.

model

The dependent variable denotes the natural log difference of GDP per capita adjusted for PPP, retrieved from the World Bank. The independent variables are the initial income and a vector of growth determinants. Gamma captures the time-invariant unit-specific effects and eta the time effects.

The vector of growth determinants consists of human capital, the natural log difference of population, the share of investment in total GDP and a measure of export diversification. Population and investment are taken as proxies for employment and savings, respectively. Together with human capital, these were retrieved from the Penn World Table 8.1 release.

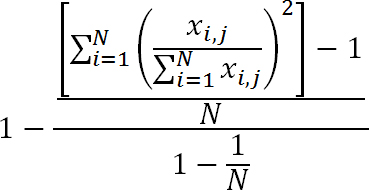
Export diversification is defined as the residual of a normalised Herfindahl-Hirschman index.

index

The equation exhibits reporter country i exports commodity x to partner j. The data was retrieved from the UN Comtrade database. To compute the indices, the chosen breakdown was the ninety-seven chapter disaggregation.

The sample period used as an input to the model runs from 1996 to 2011 on an annual frequency and covers Bangladesh, China, India, Indonesia, Malaysia, the Philippines and Thailand.

The model is estimated as a system generalised method of moments (GMM) similar to Arellano and Bover (1995) and Blundell and Bond (1998). This specification uses as instruments the first-differenced equations with up to four lag levels and equations in levels with up to four lag first-differences.

Estimation and robustness check

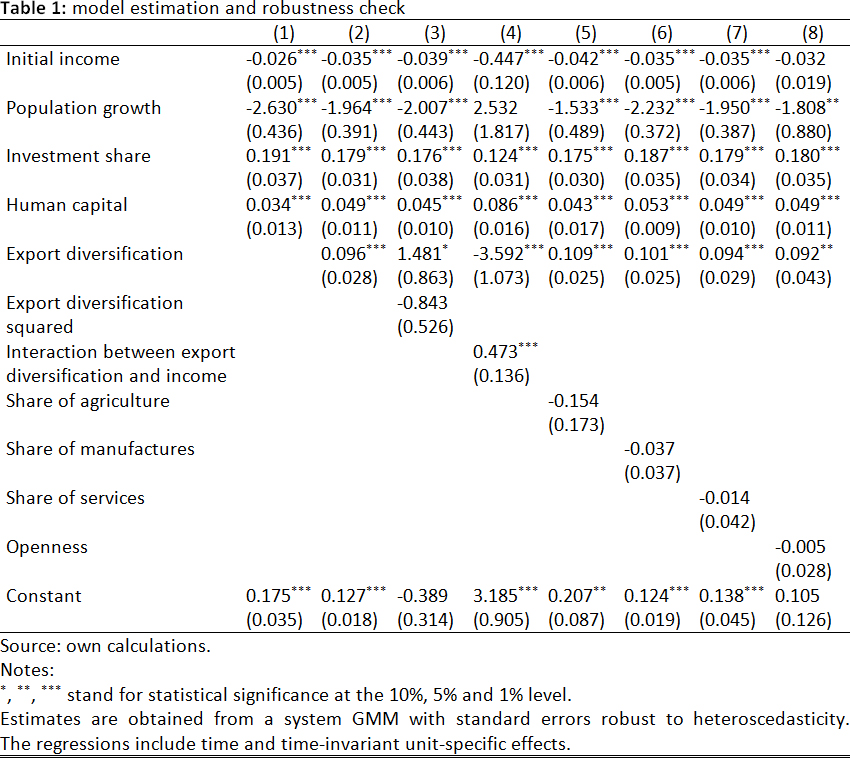
tableColumn 1 in Table 1 presents the estimation for the augmented Solow model. The computed coefficients are significant and have the expected sign. There is evidence from column 2 that export diversification has a positive and significant effect on GDP per capita growth as has already been predicted in previous studies. Columns 5 to 8 supports the robustness of export diversification with the inclusion of different control variables. If openness is entered as it is in column 8, initial income becomes not significant. The performance on this indicator varies across countries in the sample. In the case of the Philippines and Malaysia there is a downward trend. However, in the former the initial values were remarkably high. China has also experienced a decrease in its level of openness in the aftermath of the crisis.

Export diversification is not a linear process. It is better depicted as an inverted U-shaped pattern. On the one side, early stages of development are characterised by a concentration in production of a handful of items or extraction of natural resources. On the other side, advanced economies also specialise their exports in a number of items. The development of complex economic structures is a harbinger of increasing competitiveness and export diversification in emerging and developing economies.

Columns 3 and 4 test for the presence of nonlinearity in the relation between export diversification and GDP per capita growth. The squared term of export diversification has a negative effect on GDP per capita growth. However, it is not significant in this specification. On the contrary, the interaction term is significant and changes sign. These regressions show some evidence of a certain degree of nonlinearity.

Concluding remarks

The exercise has examined the link between export diversification and GDP per capita growth in a cluster of economies that have a particular intense relation among these indicators. The results illustrate that income could have benefited from the diversification of exports. These findings are robust and are consistent to the sample used in Hesse (2008) and previous literature on the topic.

Future research could include further variables such as partner diversification or trade in services statistics. However, the former is limited compared to trade in commodities. In addition, in order to evaluate shocks in price and cost competitiveness, real effective exchange rates could be introduced.

References

Arellano, M. & O. Bover (1995). “Another Look at the Instrumental-Variable Estimation of Error Component Models”. Journal of Econometrics Vol. 68(1), pp. 29-52.

Blundell, R. & S. Bond (1998). “Initial Conditions and Moment Restrictions in Dynamic Panel Data Model”. Journal of Econometrics, Vol. 87, pp. 115-43.

Hesse, H. (2008). “Export Diversification and Economic Growth”. Working Paper, No. 21. Commission on Growth and Development, World Bank.

Roodman, D. (2009). “How to do xtabond2: An Introduction to Difference and System GMM in Stata”. The Stata Journal, Vol. 9, No. 1, pp. 86-136.


† Trade data is reported in the Harmonised System international standardised nomenclature for traded commodities. This convention organises items into twenty-one sections, ninety-seven chapters and subsequent headings and subheadings. For example, section 15 breaks into 12 chapters such as iron and steel (72) and articles thereof (73).

About the authors

FacundoFacundo is a current student at the International Trade, Finance and Development program. Previously he worked in consulting projects on financial regulation and supervision in Latin America. He graduated in Economics from Universidad Torcuato di Tella. Connect with Facundo on Linkedin.

Alberto Alberto is a current student at the International Trade, Finance and Development program. He is a former Economist in BBVA’s Economic Research Department. He holds a BSc in Economics from Universidad Carlos III de Madrid. Connect with Alberto on Linkedin or follow him on Twitter.
Legislative Quota, Women Empowerment and Development: Evidence from Tanzania

Master project by Gregory Raiffa, Ericka Sánchez, Jan Stübner, Feodora Teti, and Andreas Wohlhüter. Barcelona GSE Master’s in International Trade, Finance, and Development

Editor’s note: This post is part of a series showcasing Barcelona GSE master projects by students in the Class of 2015. The project is a required component of every master program.


Authors: 
Gregory Raiffa, Ericka Sánchez, Jan Stübner, Feodora Teti, and Andreas Wohlhüter

Master’s Program:
International Trade, Finance and Development

Paper Abstract:

This paper analyzes whether the legislative women’s quota implemented in Tanzania has helped to reduce the existing gender gap in that country. We focus on a set of development indicators indicated by the literature and an analysis of female political activity. We exploit the variation in the number of female representatives across the 131 districts of Tanzania, employing a Difference and Differences approach including fixed effects and controlling for a number of socioeconomic variables.

Our analysis indicates that the legislative women’s quota in Tanzania has led to significant reductions in the gender gap and improvements for women. The quota has effectively increased political participation in accordance with its goals, and the level of female representation continues to rise. We find evidence that the quota has reduced the gender gap in education for certain age groups, and we find indications of small improvements to female empowerment. In accordance with previous findings in other countries, we find that the increased female representation has led to substantial investments in water infrastructure that has greatly increased the number of people with access to clean water. While we do not find significant health impacts, this may be due to limitations in our dataset.

Read the paper or view presentation slides:

[slideshare id=51097405&doc=legislative-quota-women-empowerment-slides-150730114914-lva1-app6892]

Predicting gender disparities in attitudes towards intimate partner violence against women: a case study from Rwanda

Editor’s note: This post is part of a series showcasing Barcelona GSE master projects by students in the Class of 2015. The project is a required component of every master program.


Authors: 
Mette Albèr, Ming Yu Wong, Urša Krenk & Stan deRuijter

Master’s Program:
Economics

Paper Abstract:

This paper examines the factors associated with gender disparities in attitudes towards intimate-partner violence against women (IPVAW) at the regional and household level using data from the 2010 Demo-graphic and Health Survey (DHS) in Rwanda. An OLS regression model was used at the regional level, while multivariate logistic regression models were fitted at the household level. The results show that women’s education level and women’s TV-viewing frequency are significant and consistent predictors of gender disparities at the household level, with sizeable marginal effects. More generally, many factors beyond national- and regional-level characteristics account for variation in IPVAW acceptance across genders, suggesting that more granular and sophisticated modes of analysis can help to determine the true nature of relationships between individual and household level factors and attitudes towards IPVAW.

Read the paper or view presentation slides:

Presentation Slides:

[slideshare id=50916638&doc=predicting-gender-disparities-violence-150725112951-lva1-app6892]

What can the risk neutral moments tell us about future returns?

Editor’s note: This post is part of a series showcasing Barcelona GSE master projects by students in the Class of 2015. The project is a required component of every master program.


Authors:
Juan Imbet, Nuria Mata

Master’s Program:
Finance

Paper Abstract:

We test if the first four moments of the risk neutral distribution implicit in options’ prices predict market returns. We estimate the risk
neutral distribution of the S&P 500 over different frequencies using a non parametric polynomial fitting, and test if the first four moments of the distribution predict returns of the S&P 500. Our results suggest that there is no evidence on this predictability power.

Presentation Slides:

[slideshare id=50497458&doc=risk-neutral-future-returns-150714070303-lva1-app6891]

The pass-through of United States monetary policy to emerging markets: evidence at the firm level from India

Master’s project by Ana Arencibia Pareja, Marina Conesa Martínez, Iuliia Litvinenko, and Ruth Llovet Montañés

Editor’s note: This post is part of a series showcasing Barcelona GSE master projects by students in the Class of 2015. The project is a required component of every master program.


Authors: 
Ana Arencibia Pareja, Marina Conesa Martínez, Iuliia Litvinenko, and Ruth Llovet Montañés

Master’s Program:
International Trade, Finance and Development

Paper Abstract:

This paper evaluates the reaction of Indian firms’ equity prices to U.S. monetary policy changes during the period from 2005 to 2015, limiting the analysis to the days where monetary policy announcements took place. We find that a one percentage point permanent increase in Fed funds rate is associated with a 0.09% drop in equity prices, being this association large in economic terms. Results also show that the response of Indian companies is not homogeneous. For instance, we find that equity prices of companies with higher capital over total assets react less compared to firms with low capital levels, given the same U.S interest rate increase. Moreover, we also see that larger firms, proxied by the number of employees, will be less affected by the U.S monetary tightening. The same conclusions can be obtained when using EBIT over interest expenses, cashflows over sales and dividends per share. Besides, we show that stocks respond much stronger to monetary shocks in periods of contractionary interventions and higher global risk aversion. We propose firms to be better capitalized by holding more equity relative to loans and relying less on banks’ short-term external debt denominated. Finally, we also recommend them to have more liquidity, which goes in line with having a larger EBIT and bigger cashflows. However, we can definitely conclude that advanced economies should promote greater international policy cooperation and communicate their monetary policy intention. This would reduce the risk of large market volatility of Emerging Countries´ economies.

Presentation Slides:

[slideshare id=50496909&doc=us-monetary-policy-emerging-markets-150714064158-lva1-app6892]