Brazil: from boom to bust?

Post by Facundo Abraham ’16 and Alberto González de Aledo Pérez ’16, current master’s students in the Barcelona GSE International Trade, Finance, and Development Program.


In 2001 it was widely predicted that in a decade’s time, Brazil, Russia, India and China (dubbed the BRICs) would become leading economies in the world, reshaping the global economy and international institutions. Now, more than a decade later, with the BRICs economies slowing down, these countries have lost momentum and there is doubt whether the BRICs’ will actually take over the world economy. The most paradoxical case is perhaps Brazil. Once seen as the country of the future and put forward as an example of economic success, it has now sunk into recession, high inflation and corruption scandals. So, what happened to Brazil? How did the country go from being the pampered child of international investors to a pariah in just a decade? What we argue is that when the figures are examined, they reveal that since 2001 the economic performance of Brazil was far from spectacular and, in fact, rather disappointing. Thus, the negative shift in expectations towards Brazil should come as no surprise.

We will focus on a simple growth accounting exercise. Simply stated, we assume that output in an economy is produced under a Cobb-Douglas production function in which capital and labour are used as inputs together under a certain technology/productivity. Mathematically:

equation

Then, to eliminate the effect of country size on output, we can define output per worker as:

equation

In this way, we can see that growth can be derived from two sources: technological progress and capital accumulation such that:

equation

Did Brazil keep up pace with the other BRICs?

The first question we need to answer is whether Brazil was experiencing high growth rates like the rest of the BRICs. The data shows that after 2001, the economy of Brazil lagged behind the other BRIC countries. Between 2002 and 2011 output per worker grew on average only 1.2%, far behind the 8.5% in Russia, 7.3% in China and 6.9% in India. Comparing the growth rates year by year clearly shows the sluggish performance of Brazil among the BRICs.
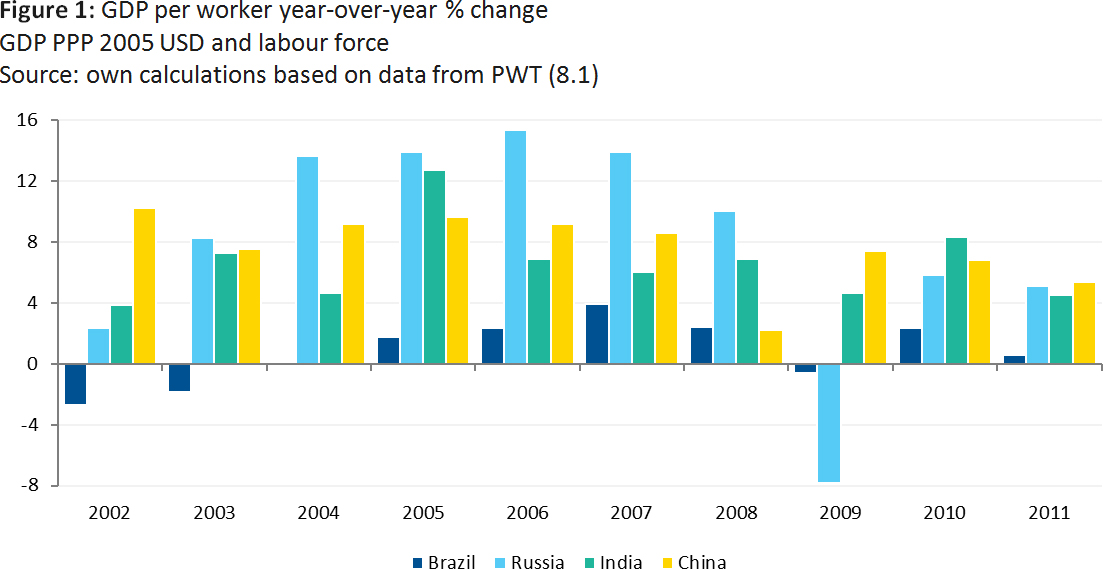
figure

Going further, we can ask ourselves how did Brazil perform related to capital accumulation and productivity growth. In the period 2002-2011 capital accumulation in Brazil was low with the capital per worker ratio growing on average by 2.3%. This figure is far less than the 11.4% in China and 8.6% in India. Yes, Brazil did better than Russia where the ratio increased by 1.9% yearly. However, Russia beat Brazil by far in productivity growth. While in Russia productivity grew on average 7.7% per year, in Brazil it grew by only 0.2%. Brazil was the BRIC country with lowest productivity growth being also behind India (2.5%) and China (0.4%).
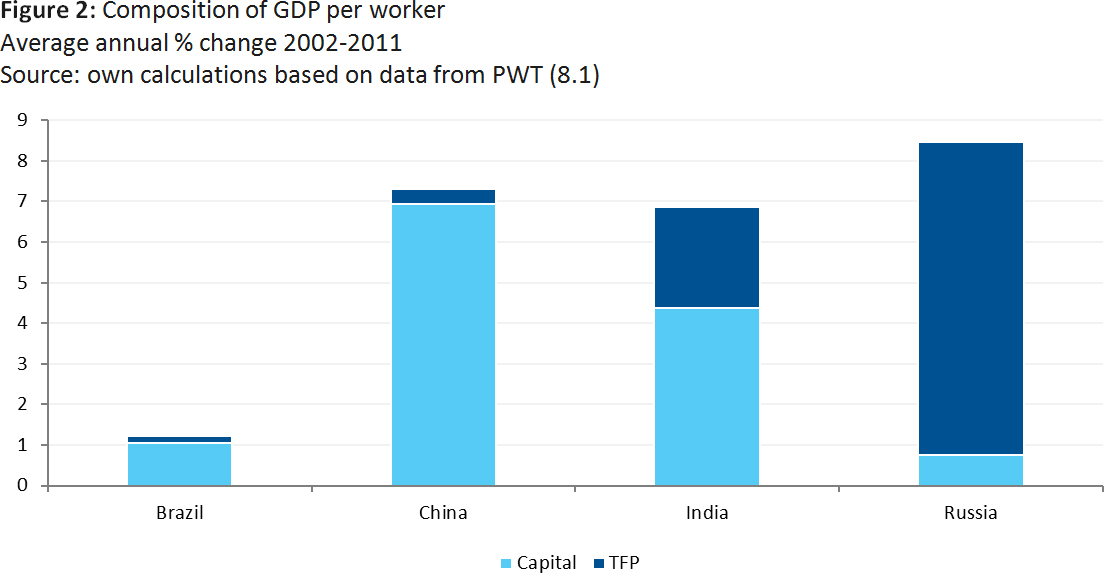
figure 2

But was Brazil doing better than before?

Even though Brazil could have been doing worse than the rest of the BRICs, maybe Brazil was experiencing an economic boom compared to the previous years, which motivated the positive change in investor sentiment. However, again the data shows that Brazil performed worse since 2001 than in the 90s. Between 1990 and 2001 the Brazilian output per worker grew at 3.9% on average per year, with capital per worker growing at 4.5% and productivity at 1.8%. As shown below, these figures are better than the ones from 2002 onwards.
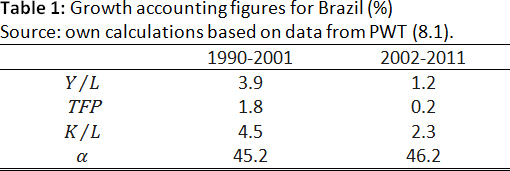
table

An interesting observation comes from analysing the capital intensity ratio, measured as capital stock over output. In the growth literature, as an economy moves towards its steady state, the growth rate of the capital to output ratio diminishes and eventually becomes zero in the steady state. Thus, the growth rate of capital to output is called “transitional growth” while the growth rate of productivity is the long-term growth. Looking at the data, the growth of the capital intensity ratio in Brazil dropped over recent years, being near to zero. This behaviour is more consistent with an economy that is exhausting its growth rather than with an economy entering a period of high growth.
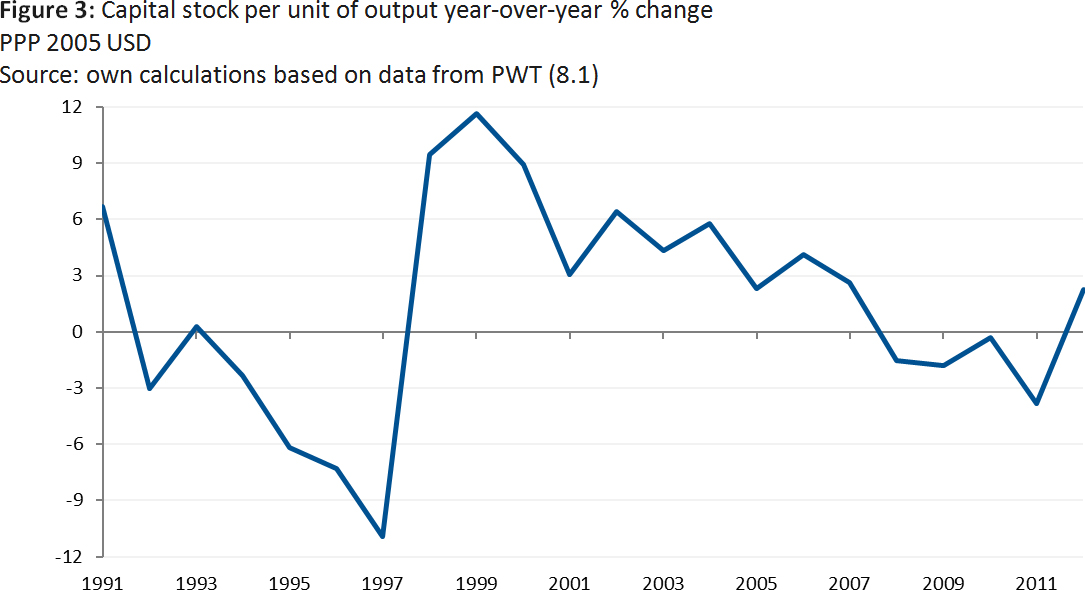
figure 3

More Latin American, less BRIC

A final analysis consists in comparing the economic performance of Brazil to the other two big Latin American economies: Argentina and Mexico. Brazil’s output per worker growth of 1.2% per year was less than the 4.2% in Argentina and 1.5% in Mexico. In addition, comparing the growth rates for each year shows that the behaviour of the three economies was very similar and, moreover, Brazil performed worse than Argentina.
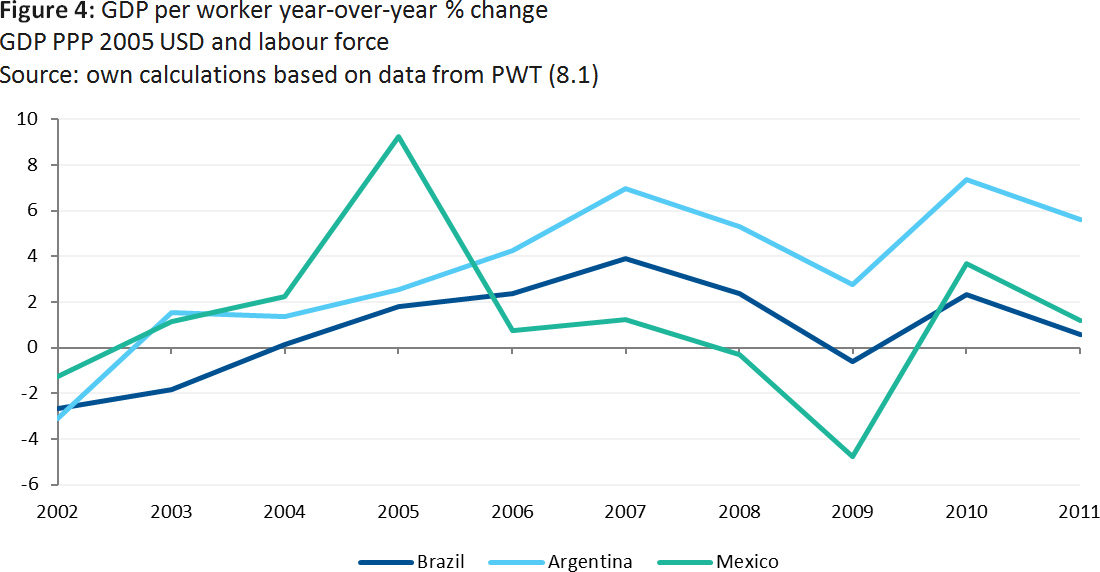
figure 4

This simple comparison could support the view that Brazil does not seem to have behaved like the other BRICs, being closer in performance to its Latin American neighbours. This observation is important considering that while Brazil was a star in the international markets, Mexico and Argentina were viewed with far more pessimism.

Concluding remarks

This growth accounting exercise is useful in providing simple insights that help us understand more clearly what has happened to Brazil over the last decade. There are many reasons behind the rise and fall of the Brazilian economy and it is not the aim of this article to account for them all. The results are enlightening because they show that, after being included in the BRICs and brought into the spotlight of financial markets, Brazil’s economic performance was modest compared to the other BRIC countries and even to its own past performance. Thus, even before the start of the crisis, the Brazilian economy showed some weaknesses that should have raised red flags early on.

About the authors

FacundoFacundo is a current student at the International Trade, Finance and Development program. Previously he worked in consulting projects on financial regulation and supervision in Latin America. He graduated in Economics from Universidad Torcuato di Tella. Connect with Facundo on Linkedin.


Alberto Alberto is a current student at the International Trade, Finance and Development program. He is a former Economist in BBVA’s Economic Research Department. He holds a BSc in Economics from Universidad Carlos III de Madrid. Connect with Alberto on Linkedin or follow him on Twitter.

The link between export diversification and economic growth

This empirical exercise examines how export diversification is related with higher GDP per capita growth.

Post by Facundo Abraham ’16 and Alberto González de Aledo Pérez ’16, current master’s students in the Barcelona GSE International Trade, Finance, and Development Program.

The diversification of exports exemplifies the transition of economies towards higher levels of development with more complex economic structures. It can also facilitate risk reallocation and mitigate negative terms of trade shocks in a certain industry or geographical area. In addition, countries exposed to international competition can benefit from better ways of doing business.

This empirical exercise examines how export diversification is related with higher GDP per capita growth. For the most part it follows the dynamic panel data model proposed in Hesse (2008) for a sample of seven Asian emerging markets and developing economies. The author illustrates that these countries are considered to be a cluster characterised by both high degrees of export diversification and GDP per capita growth in the long run. The exercise updates the calculations made for this sample.

Model specification and data

The augmented version of the Solow growth model provides the necessary framework.

model

The dependent variable denotes the natural log difference of GDP per capita adjusted for PPP, retrieved from the World Bank. The independent variables are the initial income and a vector of growth determinants. Gamma captures the time-invariant unit-specific effects and eta the time effects.

The vector of growth determinants consists of human capital, the natural log difference of population, the share of investment in total GDP and a measure of export diversification. Population and investment are taken as proxies for employment and savings, respectively. Together with human capital, these were retrieved from the Penn World Table 8.1 release.

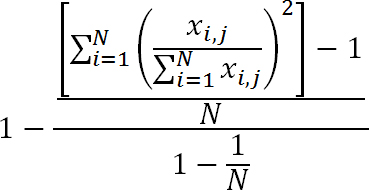
Export diversification is defined as the residual of a normalised Herfindahl-Hirschman index.

index

The equation exhibits reporter country i exports commodity x to partner j. The data was retrieved from the UN Comtrade database. To compute the indices, the chosen breakdown was the ninety-seven chapter disaggregation.

The sample period used as an input to the model runs from 1996 to 2011 on an annual frequency and covers Bangladesh, China, India, Indonesia, Malaysia, the Philippines and Thailand.

The model is estimated as a system generalised method of moments (GMM) similar to Arellano and Bover (1995) and Blundell and Bond (1998). This specification uses as instruments the first-differenced equations with up to four lag levels and equations in levels with up to four lag first-differences.

Estimation and robustness check

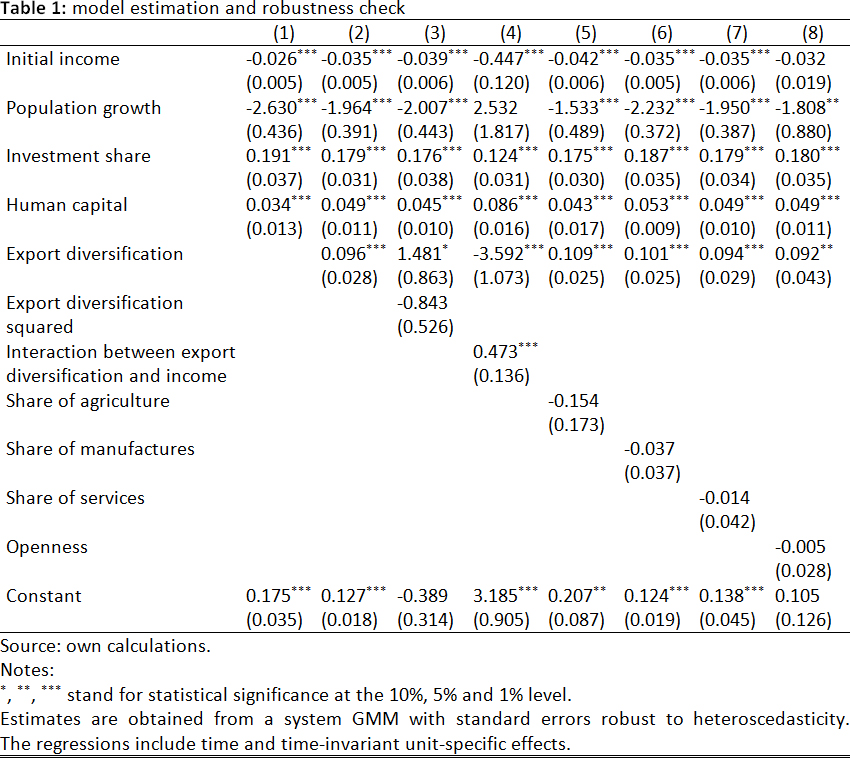
tableColumn 1 in Table 1 presents the estimation for the augmented Solow model. The computed coefficients are significant and have the expected sign. There is evidence from column 2 that export diversification has a positive and significant effect on GDP per capita growth as has already been predicted in previous studies. Columns 5 to 8 supports the robustness of export diversification with the inclusion of different control variables. If openness is entered as it is in column 8, initial income becomes not significant. The performance on this indicator varies across countries in the sample. In the case of the Philippines and Malaysia there is a downward trend. However, in the former the initial values were remarkably high. China has also experienced a decrease in its level of openness in the aftermath of the crisis.

Export diversification is not a linear process. It is better depicted as an inverted U-shaped pattern. On the one side, early stages of development are characterised by a concentration in production of a handful of items or extraction of natural resources. On the other side, advanced economies also specialise their exports in a number of items. The development of complex economic structures is a harbinger of increasing competitiveness and export diversification in emerging and developing economies.

Columns 3 and 4 test for the presence of nonlinearity in the relation between export diversification and GDP per capita growth. The squared term of export diversification has a negative effect on GDP per capita growth. However, it is not significant in this specification. On the contrary, the interaction term is significant and changes sign. These regressions show some evidence of a certain degree of nonlinearity.

Concluding remarks

The exercise has examined the link between export diversification and GDP per capita growth in a cluster of economies that have a particular intense relation among these indicators. The results illustrate that income could have benefited from the diversification of exports. These findings are robust and are consistent to the sample used in Hesse (2008) and previous literature on the topic.

Future research could include further variables such as partner diversification or trade in services statistics. However, the former is limited compared to trade in commodities. In addition, in order to evaluate shocks in price and cost competitiveness, real effective exchange rates could be introduced.

References

Arellano, M. & O. Bover (1995). “Another Look at the Instrumental-Variable Estimation of Error Component Models”. Journal of Econometrics Vol. 68(1), pp. 29-52.

Blundell, R. & S. Bond (1998). “Initial Conditions and Moment Restrictions in Dynamic Panel Data Model”. Journal of Econometrics, Vol. 87, pp. 115-43.

Hesse, H. (2008). “Export Diversification and Economic Growth”. Working Paper, No. 21. Commission on Growth and Development, World Bank.

Roodman, D. (2009). “How to do xtabond2: An Introduction to Difference and System GMM in Stata”. The Stata Journal, Vol. 9, No. 1, pp. 86-136.


† Trade data is reported in the Harmonised System international standardised nomenclature for traded commodities. This convention organises items into twenty-one sections, ninety-seven chapters and subsequent headings and subheadings. For example, section 15 breaks into 12 chapters such as iron and steel (72) and articles thereof (73).

About the authors

FacundoFacundo is a current student at the International Trade, Finance and Development program. Previously he worked in consulting projects on financial regulation and supervision in Latin America. He graduated in Economics from Universidad Torcuato di Tella. Connect with Facundo on Linkedin.

Alberto Alberto is a current student at the International Trade, Finance and Development program. He is a former Economist in BBVA’s Economic Research Department. He holds a BSc in Economics from Universidad Carlos III de Madrid. Connect with Alberto on Linkedin or follow him on Twitter.
How the concept of sunk costs changed my life – Laura Hopkins ’14

Bike trip

In October 2015 I went on a cycle-touring holiday with my bici-friki boyfriend. It was loads of fun. And loads of hard work. Every day was a new challenge:

  • the fancy bike computer that was showing us the route was set on training mode on the first day – it took us 112km to do a 50km stretch on the back roads up the mountains;
  • I suffered not one, not two, but three unfortunate punctures on the road;
  • and then there was that storm we tried to ride through.

(I still highly recommend bike touring, and count the holiday as a highlight of the year. And I had an otherwise great year, too.)

We were trying to reach Trieste in Italy to visit our friend Rafael. We had two weeks before we were due to show up for a flight home from nearby Venice. (We were optimistic.) One week in – when it was clear we wouldn’t be able to cycle there in time unless our panniers turned into combustion engines overnight – we decided to bite the bullet and book a few trains that would get us there in time to hang out with Rafael for a few days and fly home.

Remember that storm I told you about? Well, it scuppered all our plans. There we were ready to take our trains in the direction of Italy, and the line was completely down due to storm damage.

There were six days left of our holiday before we needed to be back at work. We waited a day, figuring we could check out the town we found ourselves in (Avignon – beautiful) – it would take 1.5 days to get from Avignon to Trieste by train, so after waiting one day in Avignon and then travelling, we’d still have 3.5 days before needing to get our flight. That was cool with us.

sights

However, the trains weren’t running the next day either. Should we wait another day? Now we’re only looking at 2.5 days in Trieste. Of course we waited. Rafael is an awesome guy and a great friend.

But the following day brought us no luck. If we waited another day, we’d only have 1.5 day between arriving in Trieste and flying back from Venice. Yes, it’s close, but it’s still half a day of travelling to the airport etc.

We were faced with the decision to either:

  1. wait for another day and only perhaps be able to get on the train, and then spend half of our remaining three days of holiday travelling, only to spend one night with Rafael and then turn around and fly home.

OR

  1. Cycle back the way we had come, away from the bad weather, and enjoy four further days on the road.

How much had we paid on the tickets?

  • Two TGV tickets from Avignon to Nice +
  • Two fast rail tickets from Nice to Milan +
  • Two train tickers from Milan to Trieste +
  • Two flights from Venice to Barcelona, including luggage and bike fees =

Somewhere back there I estimated this to be in the region of €600 total.

We decided to turn our bikes around and cycle back to Barcelona. We could make it to the border in four days and then hop on a train.

That was one expensive decision, right?

No. The concept of sunk costs tells us why not.

This somewhat counter-intuitive lesson reminds us that we can’t change the past – perhaps not such a revolutionary concept when you put it that way. Sunk costs tells us to make decisions about the future, taking into account only prospective costs, and not those already incurred (unless you have a time machine, in which case don’t tell me because I will be mad you didn’t lend it to me when I clearly needed it to tell myself not to buy those tickets.)

We would have paid the money had we been sat on the trains or not. In this moment, we were facing the decision as per points 1 and 2 above, but with no reference at all to the expenditure on the tickets. That was history. Yesterday’s news. Somebody else’s money.

There were no regrets.

I knew we hadn’t lost €600.

Econ told me so.


Laura Hopkins graduated from the Barcelona GSE Master in Economics of Public Policy in 2014. She divides her time between creating, monitoring, and evaluation frameworks for international development programs, and developing her business, Healthy Start Holidays.

Women-headed households: The need for good data – Yajna Sanguhan ’14

International Trade, Finance, and Development alum Yajna Sanguhan ’14 is a research assistant at the Centre for Poverty Analysis (CEPA), a think tank in Sri Lanka. An article she wrote on women-headed households (WHHs) has just been published in that country’s DailyFT newspaper.

Excerpt from the article:

“While we continue to use the concept of “head of the household”, it is imperative that as a first step to deconstructing WHHs and informing policy makers, new methods are employed to collect data and a rigorous, holistic approach is taken to capture the diverse and nuanced experiences amongst Women-Headed Households in Sri Lanka…

Understanding the gendered dimensions of poverty not only requires superior data but a better use of the currently available data.

Read the full article on DailyFT

The article is part of an ongoing series of articles by the Centre for Poverty Analysis (CEPA) about WHHs that tries to present a more nuanced understanding of the topic. There are many WHHs across Sri Lanka, but there has been a rise due to the 26-year civil war, which ended in 2009.

ysanguhan
Yajna has been working at CEPA for a year and developed this article as a result of her research into gender and poverty in the context of post-war Sri Lanka.

Follow Yajna on Twitter @y_sangu or connect on LinkedIn

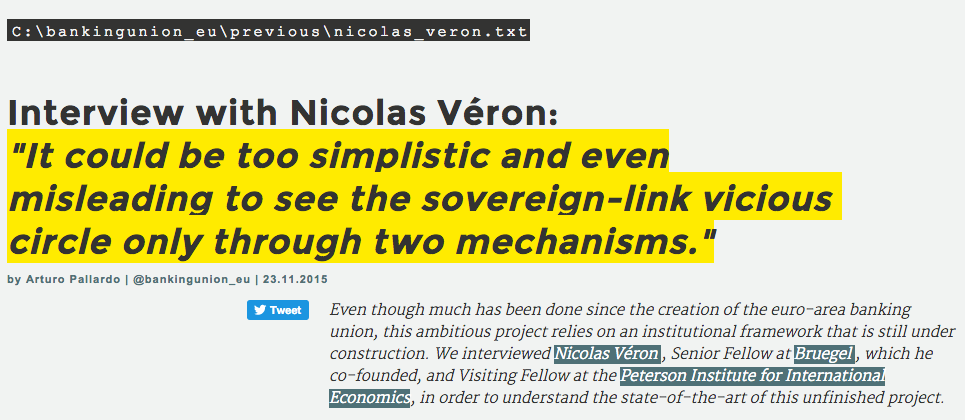
New banking union website by Arturo Pallardó ’15

Economics alum Arturo Pallardó ’15 has created a new website to follow the evolution of the European banking union.

Arturo Pallardó (Master in Economics ’15) is the creator of the @bankingunion_eu Twitter account and has just launched a new website to follow the evolution of the European banking union. Here he tells Barcelona GSE Voice readers about the project:
interview-bankingunion

As expressed by the European Central Bank, the construction of a banking union emerged from the financial crisis of 2008 and the subsequent sovereign debt crisis: “It became clear that, especially in a monetary union such as the euro area, problems caused by close links between public sector finances and the banking sector can easily spill over national borders and cause financial distress in other EU countries”.

However, this European project is still under construction. The ultimate goal of this www.bankingunion.eu website is to gather and structure banking union-related documents, from legislative acts to research papers, while fostering the debate on those issues that are unfinished.

Meanwhile, in the current beta version of the web the reader will find different interviews with academics, researchers and professionals discussing some of these banking union topics.

alumni

Visit www.bankingunion.eu

Follow @bankingunion_eu on Twitter

Connect with Arturo on LinkedIn

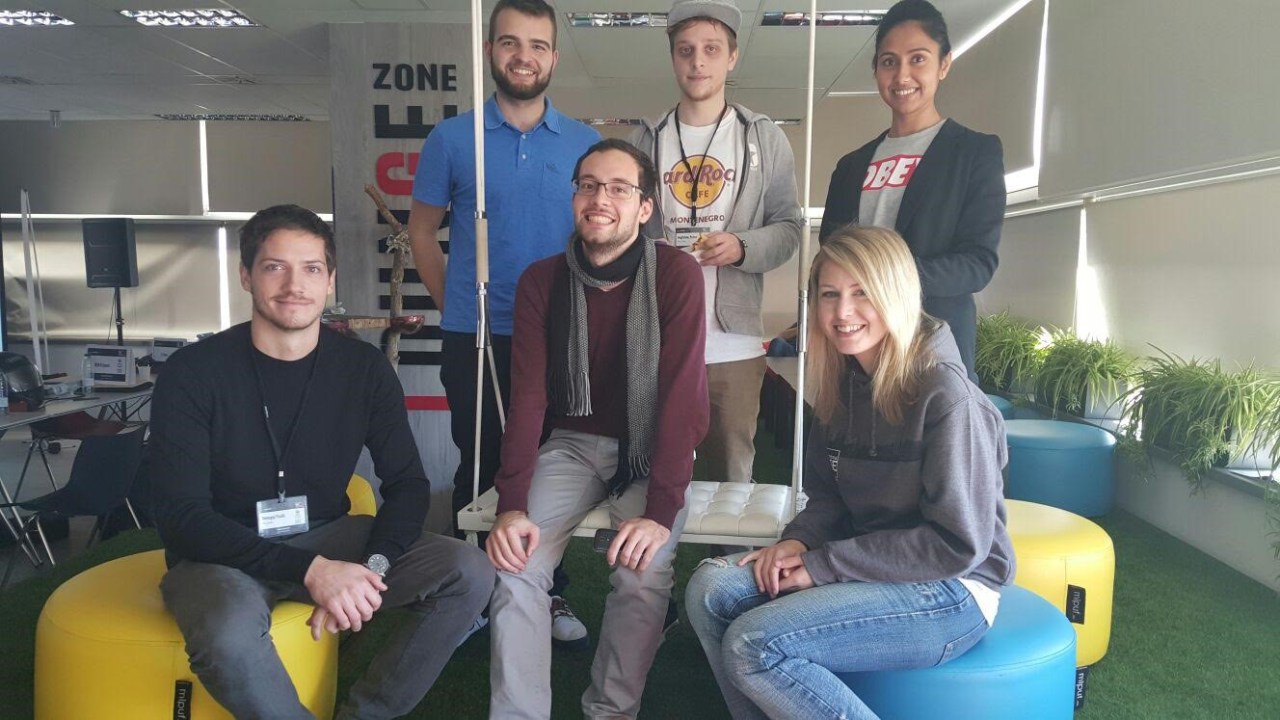
Hackathon: 24 hours to predict 7-day churn for SocialPoint’s Dragoncity game

Follow the 24-hour adventure of Data Science students and find out which Barcelona GSE personality was on-site at the Agbar tower to judge the results!

dragoncity

Over on the Barcelona GSE Data Science blog, you can read a post by Aimee Barciauskas about the Dragoncity hackathon that she and several other Data Science students participated in last week. Follow their 24-hour adventure and find out which Barcelona GSE personality was on-site at the Agbar tower to judge the results!

Data Science field trip to Spain’s most powerful computing cluster

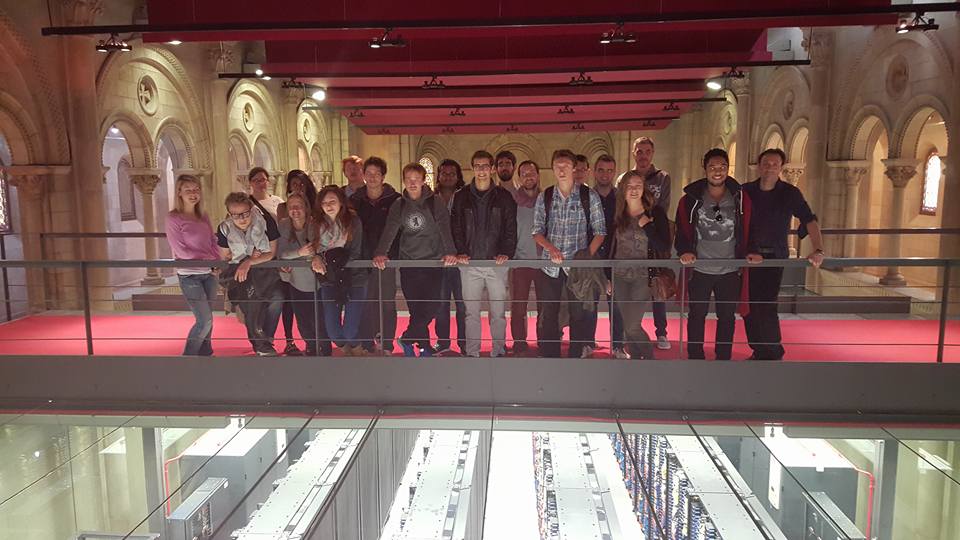
Unburying ourselves from a pile of Latin and Greek letters, most notably q’s and delta’s and little red g‘s, the 2015-16 candidates for a Master’s in Data Science visited MareNostrum, Spain’s most powerful computer cluster located on the western edge of inland Barcelona.

BSC

Everyone needs to take a break once in awhile. Unburying ourselves from a pile of Latin and Greek letters, most notably q’s and delta’s and little red g‘s, the 2015-16 candidates for a Master’s in Data Science at the Barcelona Graduate School of Economics visited MareNostrum, Spain’s most powerful computer cluster located on the western edge of inland Barcelona.

Read the full post on the Barcelona GSE Data Science blog

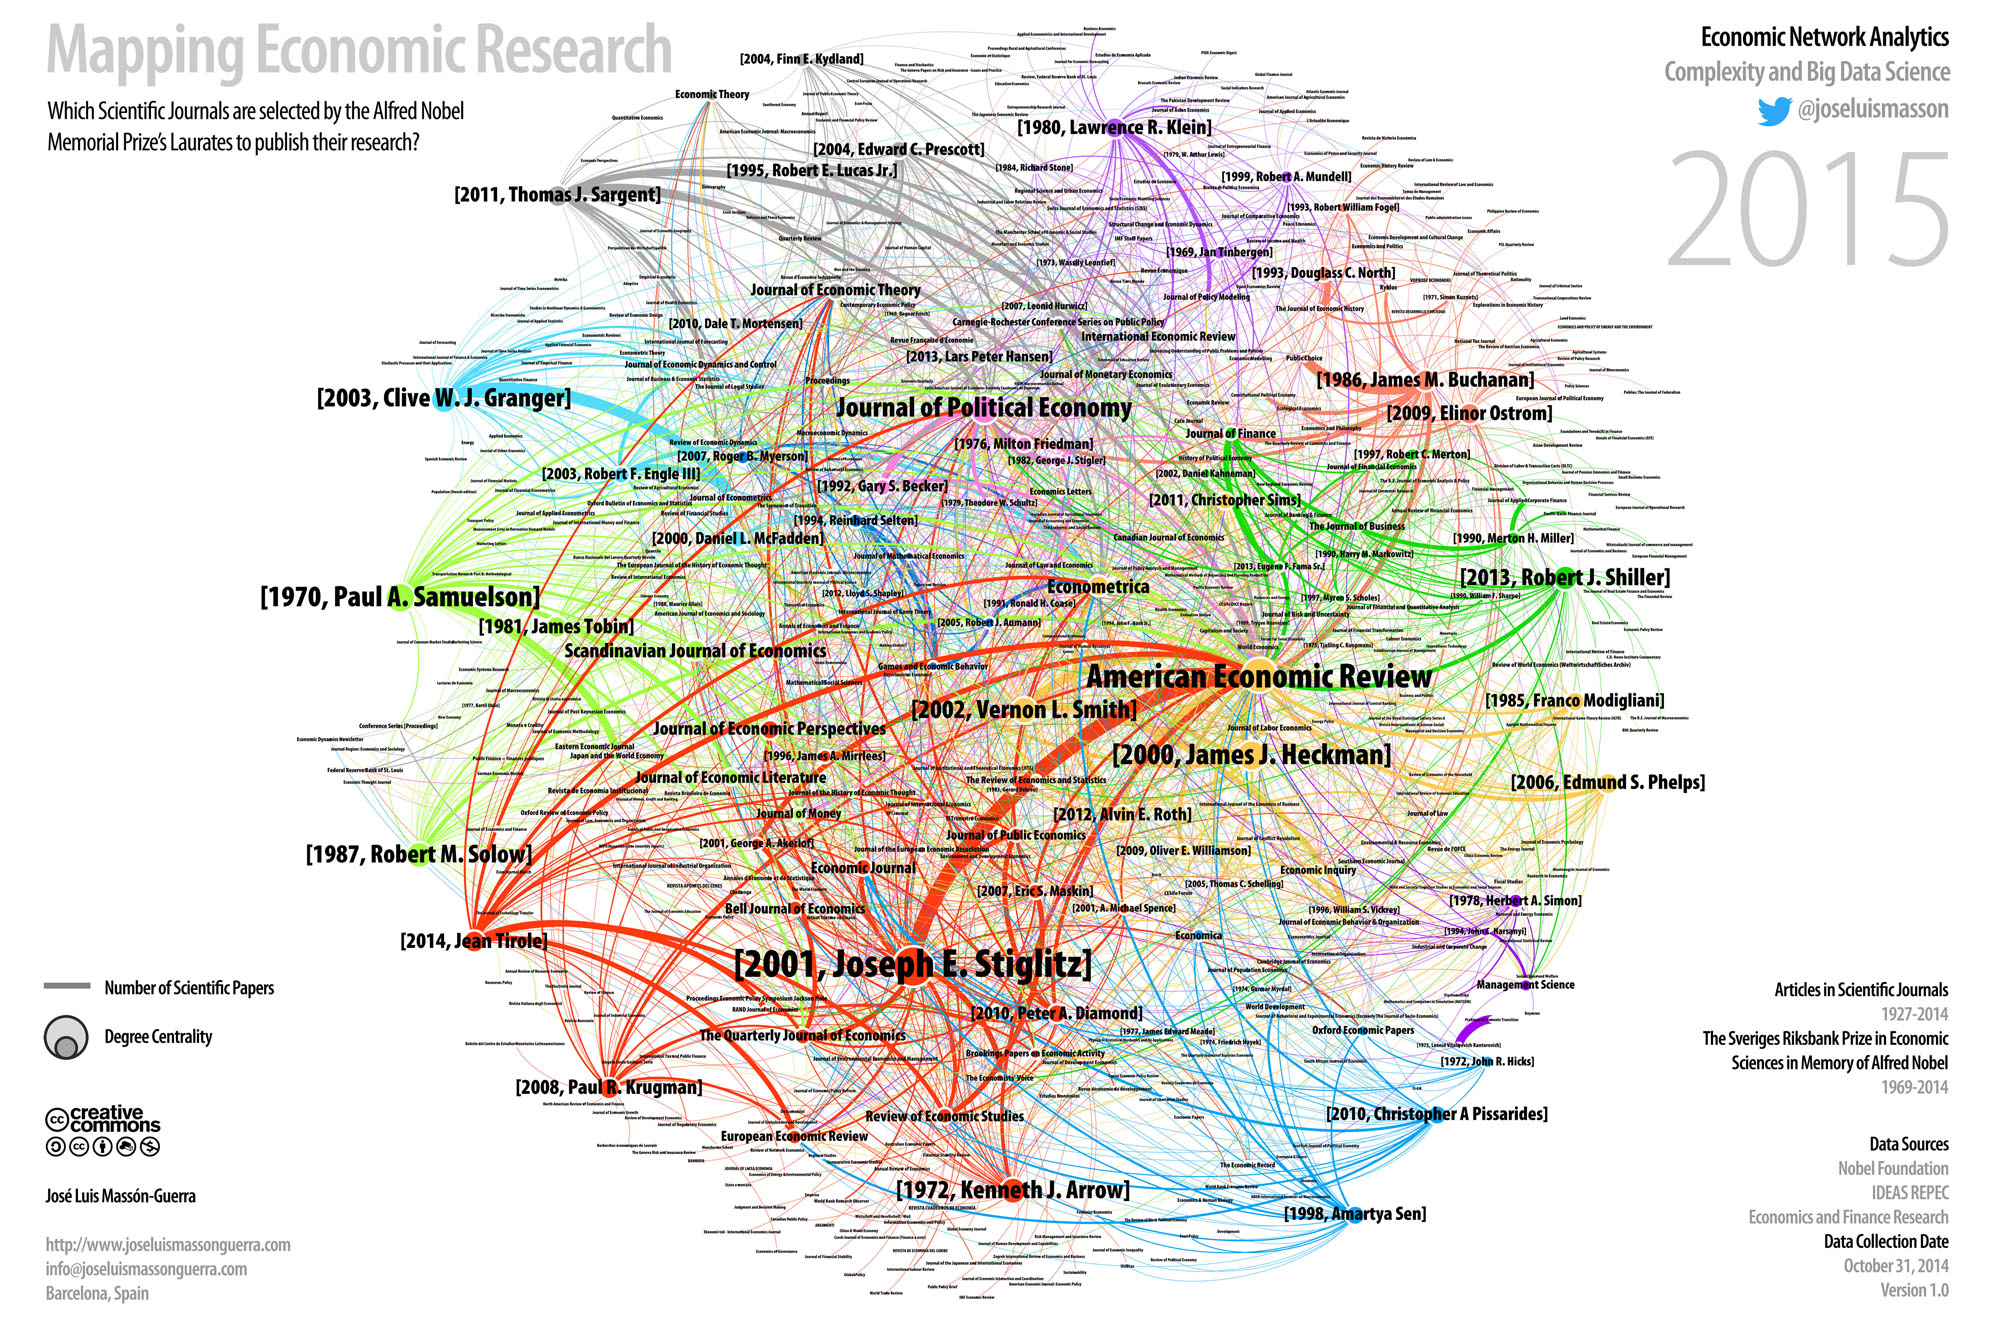
Mapping economic research: where to Nobel Laureates publish their work?

The main idea is to show a graphical representation about the scientific publication patterns that have adopted the winners of the Economic Sciences Prize given by the Nobel Foundation.

map

Work by José Luis Massón-Guerra (MESI’08, DEMO-PhD)

The main idea is to show a graphical representation about the scientific publication patterns that have adopted the winners of the Economic Sciences Prize given by the Nobel Foundation (officially, this recognition is known as the Sveriges Riksbank Prize in Economic Sciences in Memory of Alfred Nobel; colloquially, it is known as the Nobel laureate in economics).

Read more about this project

The Persistent Effect of Exposure to Civil Conflict on Political Beliefs and Participation: Evidence from the Peruvian Civil War

This post is part of a series showcasing Barcelona GSE master projects by students in the Class of 2015.

Editor’s note: This post is part of a series showcasing Barcelona GSE master projects by students in the Class of 2015. The project is a required component of every master program.


Authors: 
Benjamin Anderson and Ramiro Antonio Burga

Master’s Program:
Economics of Public Policy

Paper Abstract:

This paper provides empirical evidence of the persistent effects of exposure to civil conflict on political beliefs and participation. We exploit the variation in geographic incidence of conflict and birth cohorts to identify the long-term effects of exposure to violence on belief in democracy, trust in institutions, opinions in support of civil rights, voting turnout and casting of blank ballots, and participation in civic organizations. Conditional on being exposed to violence, the average person exposed to violence during certain sensitive stages of life still holds slightly more negative opinions about the value of democracy and are less likely to participate in civic / political organizations in the long-run.

Presentation Slides:

[slideshare id=53321203&doc=civil-conflict-political-beliefs-peru-150929115151-lva1-app6892]

About the paper

Motivation:

Political preferences heavily dictate the role of the government, the policy making processes that emerge, and potentially even the institutional framework, itself (Besley and Case, 2003; Aghion et al., 2004). Furthermore, consequential effects of various forms of political institutions is a primary focus of Political Economy, and justifiably so, for the array of welfare implications encompassed within, including, economic growth, inequality, health outcomes, and many others (Acemoglu et al., 2001; 2002). In countries where citizens have been exposed to violence during sensitive periods of life, it may be more difficult for governments to gain trust and build support for democratic processes and good institutions.

Pathways/mechanisms:

There are many logical pathways which one could speculate that civil conflict might affect citizens’ political beliefs; perhaps the most conspicuous of which being trust. Lack of protection, safety, and government accountability could lead to a decrease or lack of trust in the government, while exposure to violence, fear tactics, and other criminal behavior could result in distrust toward other members of society (Jaeger and Paserman, 2008; Rohner et al., 2013). Secondarily, residual effects of civil conflict in the form of fear, in particular for safety, could dissuade citizens from various forms of political participation (Salamon and Evera, 1973).

Summary of findings:

We examine the effect of exposure to conflict during sensitive developmental periods of life on persistent changes to various measures of political beliefs and participation. The results show that the average person exposed to conflict during the age range 13 to 17 will have slightly more negative opinions about democracy well over a decade after the conclusion of the violence. Very minor long-term effects are also present for participation in civic organizations. Our results show that the average person exposed to conflict during the age range of 7 to 12 has a decreased likelihood of participating in civic organizations of approximately 3% to 6% for each additional year that the individual experienced violence in his/her district during this period of life. While these effects are economically small, it is notable that any long-term effect is detected given the likely presence of strong attenuation bias as discussed in our threats to identification. We find that the most sensitive stages of life for the formation of political beliefs, with respect to exposure to conflict, are the pre-teen and teenage years. Contrary to the effects of violence exposure on human capital and labor market outcomes, we do not find effects occurring at the earliest life stages.

Inferences:

  1. The detection of effects in both belief and action variables not only helps to validate one another, but it also suggests that beliefs indeed translate to actions. This connection provides some evidence that changes in political perception also corresponds with political behavioral change.
  2. Even though the effects we detect are relatively small, they might have been severe during and shortly following the civil war.
  3. Although we are unable to further analyze heterogeneous effects, the effects could be quite large for certain individuals who may have been exposed to more extreme amounts or types of violent acts.

Policy Implications:

Knowledge of the size and temporality of these consequential effects of civil conflict on political beliefs and participation as well as mechanisms which drive these changes would be invaluable. This would allow policy makers to develop targeted strategies to help combat the destructive effects of violence on citizens’ political beliefs and behavior that could undermine the healthy growth, development, and stability of society.

On the experience:

The thesis was almost certainly the most fun and rewarding assignment of the year, despite the imposing time constraint. Having received rigorous training to acquire the tools needed for such a project, and having discovered and nurtured our own interests via exposure to a multitude of prominent literature in various applied topics throughout the year, it was exciting to unleash the knowledge we had gained and apply some of our empirical techniques to a new and interesting research question of our own.

Throughout the program, but especially during the thesis, we were fortunate to have access to the knowledge and support of professors. Aided by some enthusiastic and accomplished mentors, we evolved our expectations of ourselves. Their expertise in areas related to those of our paper – conflicts, violence and political economy – optimized the quality of feedback and constructive critique we received in the process. The final presentation to our directors, professors and peers was another valuable component. It served as a welcome challenge that exercised essential communication skills, not only for conveying complex ideas to an audience, but adroitly and favorably reacting to questions and criticism.

The feeling of accomplishment derived from materializing a quality piece of empirical work is great motivation to build on for the future. Just one year ago, not only would this project have been impossible to execute, even the vision of it coming together was unfathomable. By the final term, we knew that we were prepared; now, we carry forth these tools, creativity, and confidence in our abilities.

On working with a coauthor:

At the outset, the thought of working with a coauthor for the thesis did not sound ideal, but ultimately, it had many advantages. It offered another opportunity to gain from the international and cultural diversity of one another and to develop these working and personal relationships; it was an invaluable intangible experience for which we will be forever thankful. Our complimentary skillsets and working styles prevented this beast from ever becoming a burden. We are proud of what we were able to achieve given the constraints, and ended up with a final project that far surpassed anything that we could have done independently within the same amount of time.