Household level effects of flooding: Evidence from Thailand

International Trade, Finance, and Development master project by Zhuldyz Ashikbayeva, Marei Fürstenberg, Timo Kapelari, Albert Pierres, Stephan Thies ’19

Source: NY Times

Editor’s note: This post is part of a series showcasing BSE master projects. The project is a required component of all Master’s programs at the Barcelona School of Economics.

Abstract

This thesis studies the impacts of flooding on income and expenditures of rural households in northeast Thailand. It explores and compares shock coping strategies and identifies household level differences in flood resilience. Drawing on unique household panel data collected between 2007 and 2016, we exploit random spatio-temporal variation in flood intensities on the village level to identify the causal impacts of flooding on households. Two objective measures for flood intensities are derived from satellite data and employed in the analysis. Both proposed measures rely on the percentage area inundated in the surrounding of a village, but the second measure is standardized and expressed in comparison to the median village level flood exposure. We find that household incomes are negatively affected by floods. However, our results suggest that rather than absolute levels of flooding, deviations from median flood exposure are driving negative effects on households. This indicates a certain degree of adaptation to floods. Household expenditures for health and especially food rise in the aftermath of flooding. Lastly, we find that above primary school education helps to completely offset potential negative effects of flooding.

Conclusion

This paper adds to the existing body of literature by employing a satellite based measure to investigate the long-run effects of recurrent floods on household level outcomes. We first set out to identify the causal impacts of flooding on income and expenditures of rural households in Thailand. Next, we explored and compared shock coping strategies and identified potential differences in flood resilience based on household characteristics. For this purpose, we leveraged a detailed household panel data set provided by the Thailand Vietnam Socio Economic Panel. To quantify the severity of flood events, we calculated flood indices based on flood maps collected by the Geo-Informatics and Space Technology Development Agency (GISTDA) measuring the deviation from median levels of flooding in a 5km radius around a respective village. The figure below illustrates the construction of the index for a set of exemplary villages that lie in the Nang Rong district of Buri Ram in northeast Thailand.

(a) 2010 flooding in Buri Ram and surrounding provinces. Red lines mark the location of the Nong Rong district.

(b) Detailed overview of flood index construction. Red dot shows the exact location of each village with the 5 km area around each village marked by the red circle.

Our results suggest a negative relationship between floods and per household member income, for both total income and income from farming. Per household member expenditure, however, does not seem to be affected by flood events at all. The only exemptions are food and health expenditures, which increase after flood events that are among the top 10 percent of the most severe floods. The former is likely to be driven by the fact that many households in northeastern Thailand live at subsistence level, and therefore consume their farming produce. A lack of production in a given year may lead these households to substitute this loss by buying produce from markets. Rising health expenditures may be explained by injuries caused or diseases obtained during a heavy flood.

Investigating potential risk mitigation strategies revealed that households with better educated household heads suffer less during flood events. However, this result does not necessarily point to a causal relationship, as better educated households might settle in locations of the village which are less likely to be flooded. While our data does not allow to control for such settlement choices on the micro-spatial level, our findings still provide valuable insights for future policy-relevant research on the effects of education on disaster resilience in rural Thailand. Moreover, our data suggests that only very few households are insured against potential disasters. Future research will help to investigate flood impacts and risk mitigation channels in more detail.

Authors: Zhuldyz Ashikbayeva, Marei Fürstenberg, Timo Kapelari, Albert Pierres, Stephan Thies

About the BSE Master’s Program in International Trade, Finance, and Development

Special talk for master’s students by Justin Yifu Lin on “New Structural Economics”

authorLecture summary by Tuomas Kari ’16 (Master’s in International Trade, Finance, and Development)


The former Chief Economist of the World Bank and member of Barcelona GSE Scientific Council Justin Yifu Lin visited Barcelona GSE on May 2nd to give a special talk to the Master students on a new approach to development policy, titled “New Structural Economics: The Third Wave of Development Thinking”. Professor Lin, who currently teaches at the National School of Development at the University of Beijing, outlined the history of development economics and its shortcomings. The goal of the lecture was to derive lessons for optimal policy and then expand upon the idea of new structural economics, the approach Prof. Lin himself advocates.

Structuralism and neoliberalism

Prof. Lin divided the history of development into two time periods: structuralism that was dominant from 1950 to the 1980s, and neoliberalism that has been the main viewpoint up to this day. Structuralism tended to assume that there were market failures that needed to be corrected with industrial policy, such as import substitution. The failure of these policies is well documented as the government-subsidized industries rarely survived at global markets and distorted the countries’ economies. Neoliberalist reaction emphasized deregulation to rid the economy of rent seeking and liberalization to let markets determine the allocation of resources. But this too failed in developing countries to reach steady growth. Often, liberalization led to the collapse of entire sectors, high unemployment and subsequent political unrest.

The main exception to these consensus policies throughout the last half a century have been the East Asian Tigers, Hong Kong, Singapore, South Korea and Taiwan, countries that followed a dual track of capitalist and state-directed policies and achieved unmatched growth rates. As these countries were initially too poor to afford expensive subsidies to heavy industry, they promoted production lower in the value chain, and even then only by piece-meal measures. According to Prof. Lin, this lack of better options guided the Tigers to good policies by accident.

photo
Professor Lin delivered the Barcelona GSE Lecture at Banc Sabadell later the same day to the entire BGSE community.

Economic growth as a result of structural transformation

New structural economics is an attempt to study the determinants of economic structure and its evolution using neoclassical methods. Prof. Lin starts from the hypothesis that economic structure is endogenous to the country’s endowments and optimal policy guides the economy to activities where it enjoys comparative advantage. If a country attempts to transform its economy to activities other than those that utilize its endowments, this will only result in distortions, breaking down of market mechanisms and rent seeking. Optimal policy must start from the development of endowments (capital stock, human capital etc.) and only after try to deal with the production structure. As economic growth is ultimately a result of structural transformation, Prof. Lin argued that governments must engage in first building up the necessary endowments and then using industrial policy to help firms enter into business.

The preconditions for economic growth are having a functioning market economy efficiently allocate resources across sectors and firms, and a facilitating state that provides transitional support for firms entering and exiting the market and liberalizing the economy gradually using discretion. Lin claimed would lead to competitiveness, openness to trade, and strong fiscal and external accounts, which allow the economy to avoid crises and engage in countercyclical policies. Another benefit would be high returns to investment that provide incentives to save.

Room for more economic research

Prof. Lin promoted the setting up of Special Economic Zones to allow firms to do business free from distortions and also work as laboratories for the government to see what the comparative advantages of the economy are. He ended the lecture by proposing the development of theoretical models capable of explaining these dynamics as a fruitful avenue for the future economists in the audience.

The link between export diversification and economic growth

This empirical exercise examines how export diversification is related with higher GDP per capita growth.

Post by Facundo Abraham ’16 and Alberto González de Aledo Pérez ’16, current master’s students in the Barcelona GSE International Trade, Finance, and Development Program.

The diversification of exports exemplifies the transition of economies towards higher levels of development with more complex economic structures. It can also facilitate risk reallocation and mitigate negative terms of trade shocks in a certain industry or geographical area. In addition, countries exposed to international competition can benefit from better ways of doing business.

This empirical exercise examines how export diversification is related with higher GDP per capita growth. For the most part it follows the dynamic panel data model proposed in Hesse (2008) for a sample of seven Asian emerging markets and developing economies. The author illustrates that these countries are considered to be a cluster characterised by both high degrees of export diversification and GDP per capita growth in the long run. The exercise updates the calculations made for this sample.

Model specification and data

The augmented version of the Solow growth model provides the necessary framework.

model

The dependent variable denotes the natural log difference of GDP per capita adjusted for PPP, retrieved from the World Bank. The independent variables are the initial income and a vector of growth determinants. Gamma captures the time-invariant unit-specific effects and eta the time effects.

The vector of growth determinants consists of human capital, the natural log difference of population, the share of investment in total GDP and a measure of export diversification. Population and investment are taken as proxies for employment and savings, respectively. Together with human capital, these were retrieved from the Penn World Table 8.1 release.

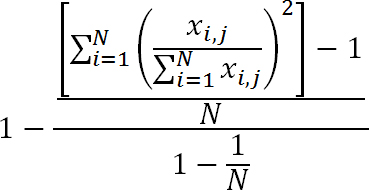
Export diversification is defined as the residual of a normalised Herfindahl-Hirschman index.

index

The equation exhibits reporter country i exports commodity x to partner j. The data was retrieved from the UN Comtrade database. To compute the indices, the chosen breakdown was the ninety-seven chapter disaggregation.

The sample period used as an input to the model runs from 1996 to 2011 on an annual frequency and covers Bangladesh, China, India, Indonesia, Malaysia, the Philippines and Thailand.

The model is estimated as a system generalised method of moments (GMM) similar to Arellano and Bover (1995) and Blundell and Bond (1998). This specification uses as instruments the first-differenced equations with up to four lag levels and equations in levels with up to four lag first-differences.

Estimation and robustness check

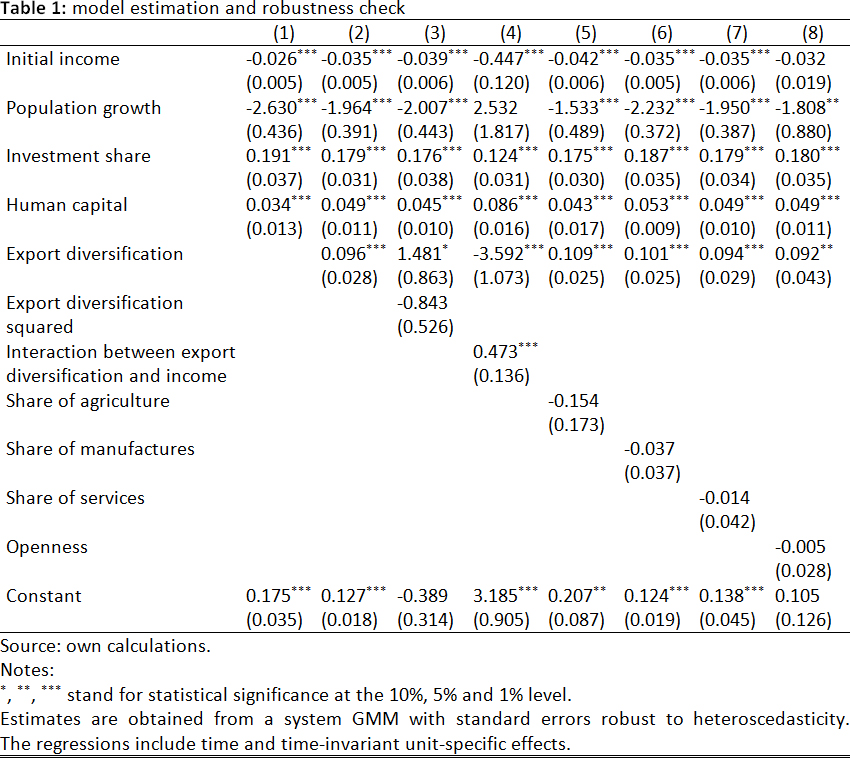
tableColumn 1 in Table 1 presents the estimation for the augmented Solow model. The computed coefficients are significant and have the expected sign. There is evidence from column 2 that export diversification has a positive and significant effect on GDP per capita growth as has already been predicted in previous studies. Columns 5 to 8 supports the robustness of export diversification with the inclusion of different control variables. If openness is entered as it is in column 8, initial income becomes not significant. The performance on this indicator varies across countries in the sample. In the case of the Philippines and Malaysia there is a downward trend. However, in the former the initial values were remarkably high. China has also experienced a decrease in its level of openness in the aftermath of the crisis.

Export diversification is not a linear process. It is better depicted as an inverted U-shaped pattern. On the one side, early stages of development are characterised by a concentration in production of a handful of items or extraction of natural resources. On the other side, advanced economies also specialise their exports in a number of items. The development of complex economic structures is a harbinger of increasing competitiveness and export diversification in emerging and developing economies.

Columns 3 and 4 test for the presence of nonlinearity in the relation between export diversification and GDP per capita growth. The squared term of export diversification has a negative effect on GDP per capita growth. However, it is not significant in this specification. On the contrary, the interaction term is significant and changes sign. These regressions show some evidence of a certain degree of nonlinearity.

Concluding remarks

The exercise has examined the link between export diversification and GDP per capita growth in a cluster of economies that have a particular intense relation among these indicators. The results illustrate that income could have benefited from the diversification of exports. These findings are robust and are consistent to the sample used in Hesse (2008) and previous literature on the topic.

Future research could include further variables such as partner diversification or trade in services statistics. However, the former is limited compared to trade in commodities. In addition, in order to evaluate shocks in price and cost competitiveness, real effective exchange rates could be introduced.

References

Arellano, M. & O. Bover (1995). “Another Look at the Instrumental-Variable Estimation of Error Component Models”. Journal of Econometrics Vol. 68(1), pp. 29-52.

Blundell, R. & S. Bond (1998). “Initial Conditions and Moment Restrictions in Dynamic Panel Data Model”. Journal of Econometrics, Vol. 87, pp. 115-43.

Hesse, H. (2008). “Export Diversification and Economic Growth”. Working Paper, No. 21. Commission on Growth and Development, World Bank.

Roodman, D. (2009). “How to do xtabond2: An Introduction to Difference and System GMM in Stata”. The Stata Journal, Vol. 9, No. 1, pp. 86-136.


† Trade data is reported in the Harmonised System international standardised nomenclature for traded commodities. This convention organises items into twenty-one sections, ninety-seven chapters and subsequent headings and subheadings. For example, section 15 breaks into 12 chapters such as iron and steel (72) and articles thereof (73).

About the authors

FacundoFacundo is a current student at the International Trade, Finance and Development program. Previously he worked in consulting projects on financial regulation and supervision in Latin America. He graduated in Economics from Universidad Torcuato di Tella. Connect with Facundo on Linkedin.

Alberto Alberto is a current student at the International Trade, Finance and Development program. He is a former Economist in BBVA’s Economic Research Department. He holds a BSc in Economics from Universidad Carlos III de Madrid. Connect with Alberto on Linkedin or follow him on Twitter.