Could post-Brexit uncertainty have been predicted?

By Cox Bogaards, Marceline Noumoe Feze, Swasti Gupta, Mia Kim Veloso

Almost a year since the UK voted to leave the EU, uncertainty still remains elevated with the UK’s Economic Policy Index at historical highs.  With Theresa May’s snap General Election in just under two weeks, the Labour party has narrowed the gap from Conservative lead to five percentage points, which combined with weak GDP data of only 0.2 per cent growth in Q1 2017 released yesterday, has driven the pound sterling to a three-week low against the dollar. Given potentially large repurcussions of market sentiment and financial market volatility on the economy as a whole, this series of events has further emphasised the the need for policymakers to implement effective forecasting models.

In this analysis, we contribute to ongoing research by assessing whether the uncertainty in the aftermath of the UK’s vote to leave the EU could have been predicted. Using the volatility of the Pound-Euro exchange rate as a measure of risk and uncertainty, we test the performance of one-step ahead forecast models including ARCH, GARCH and rolling variance in explaining the uncertainty that ensued in the aftermath of the Brexit vote.

Introduction

The UK’s referendum on EU membership is a prime example of an event which perpetuated financial market volatility and wider uncertainty.  On 20th February 2016, UK Prime Minister David Cameron announced the official referendum date on whether Britain should remain in the EU, and it was largely seen as one of the biggest political decisions made by the British government in decades.

Assessment by HM Treasury (2016) on the immediate impacts suggested “a vote to leave would cause an immediate and profound economic shock creating instability and uncertainty”, and in a severe shock scenario could see sterling effective exchange rate index depreciate by as much as 15 percent.  This was echoed in responses to the Centre for Macroeconomics’ (CFM) survey (25th February 2016), where 93 percent of respondents agreed that the possibility of the UK leaving the EU would lead to increased volatility in financial markets and the broader economy, expressing uncertainty about the post-Brexit world.

Resonating these views, the UK’s vote to leave the EU on 23rd June 2016 indeed led to significant currency impacts including GBP devaluation and greater volatility. On 27th June 2016, the Pound Sterling fell to $1.315, reaching a 31-year low against the dollar since 1985 and below the value of the Pound’s “Black Wednesday” value in 1992 when the UK left the ERM.

In this analysis, we assess whether the uncertainty in the aftermath of the UK’s vote to leave the EU could have been predicted. Using the volatility of Pound-Euro exchange rate as a measure of risk and uncertainty, we test the performance of one-step ahead forecast models including ARCH, GARCH and rolling variance. We conduct an out-of-sample forecast based on models using daily data pre-announcement (from 1st January 2010 until 19th February 2016) and test performance against the actual data from 22nd February 2016 to 28th February 2017.

Descriptive Statistics and Dynamic Properties

As can be seen in Figure 1, the value of the Pound exhibits a general upward trend against the Euro over the majority of our sample. The series peaks at the start of 2016, and begins a sharp downtrend afterwards.  There are several noticeable movements in the exchange rate, which can be traced back to key events, and we can also comment on the volatility of exchange rate returns surrounding these events, as a proxy for the level of uncertainty, shown in Figure 2.

Figure 1: GBP/EUR Exchange Rate

Fig 1

Source: Sveriges Riksbank and authors’ calculations

Notably, over our sample, the pound reached its lowest level against the Euro at €1.10 in March 2010, amid pressure from the European Commission on the UK government to cut spending, along with a bearish housing market in England and Wales. The Pound was still recovering from the recent financial crisis in which it was severely affected during which it almost reached parity with the Euro at €1.02 in December 2008 – its lowest recorded value since the Euro’s inception (Kollewe 2008).

However, from the second half of 2011 the Pound began rising against the Euro, as the Eurozone debt crisis began to unfold. After some fears over a new recession due to consistently weak industrial output, by July 2015 the pound hit a seven and a half year high against the Euro at 1.44.   Volatility over this period remained relatively low, except in the run up to the UK General elections in early 2015.

However, Britain’s vote to leave the EU on 23rd June 2016 raised investors’ concerns about the economic prospects of the UK. In the next 24 hours, the Pound depreciated by 1.5 per cent on the immediate news of the exit vote and by a further 5.5 per cent over the weekend that followed, causing volatility to spike to new record levels as can be seen in Figure 2.

Figure 2: Volatility of GBP/EUR Exchange Rate

fig 2

Source: Sveriges Riksbank and authors’ calculations

As seen in Figure 1, the GBP-EUR exchange rate series is trending for majority of the sample, and this may reflect non-stationarity in which case standard asymptotic theory would be violated, resulting in infinitely persistent shocks. We conduct an Augmented Dickey Fuller test on the exchange rate and find evidence of non-stationarity, and proceed by creating daily log returns in order to de-trend the series. Table 1 summarises the first four moments of the log daily returns series, which is stationary.

Table 1: Summary Statistics

Table 1.PNG

Source: Sveriges Riksbank and authors’ calculations

The series has a mean close to zero, suggesting that on average the Pound neither appreciates or depreciates against the Euro on a daily basis. There is a slight negative skew and significant kurtosis – almost five times higher than that of the normal distribution of three – as depicted in the kernel density plot below. This suggests that the distribution of daily returns for the GBP-EUR, like many financial time series, exhibits fat tails, i.e. it exhibits a higher probability of extreme changes than the normal distribution, as would be expected.

To determine whether there is any dependence in our series, we assess the autocorrelation in the returns. Carrying out a Ljung-Box test using 22 lags, as this corresponds to a month of daily data, we cannot reject the null of no autocorrelation in the returns series, which is confirmed by an inspection of the autocorrelograms. While we find no evidence of dependence in the returns series, we find strong autocorrelations in the absolute and squared returns.

The non-significant ACF and PACF of returns, but significant ACFs of absolute and squared returns indicate that the series exhibits ARCH effects. This suggests that the variance of returns is changing over time, and there may be volatility clustering. To test this, we conduct an ARCH-LM test using four lag returns and find that the F-statistic is significant at the 0.05 level.

Estimation

For the in-sample analysis we proceed using the Box-Jenkins methodology. Given the evidence of ARCH effects and volatility clustering using an ARCH-LM test but lack of any leverage effects in line with economic theory, we proceed to estimate models which can capture this: ARCH (1), ARCH (2), and the GARCH (1,1).  Estimation of ARCH (1) suggests low persistence as captured by α1 and relatively fast mean reversion. The ARCH(2) model generates greater persistence measured by sum of α1 and α2 and but still not as large as the GARCH(1,1) model, sum of  α1 and β as shown in table 2.

Table 2: Parameter Estimates
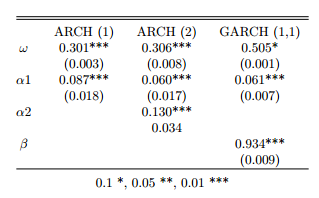
table 2

We proceed to forecast using the ARCH(1) as it has the lowest AIC and BIC in-sample, and GARCH (1,1) which has the most normally distributed residuals, no dependence in absolute levels, and the largest log-likelihood. We compare performance against a baseline 5 day rolling variance model.

Figure 3 plots the out of sample forecasts of the three models (from 22nd February 2016 to 28th February 2017). The ARCH model is able to capture the spike in volatility surrounding the referendum, however the shock does not persist. In contrast, the effect of this shock in the GARCH model fades more slowly suggesting that uncertainty persists for a longer time. However neither of the models fully capture the magnitude of the spike in volatility. This is in line with Dukich et al’s (2010) and Miletic’s (2014) findings that GARCH models are not able to adequately capture the sudden shifts in volatility associated with shocks.

Figure 3: Volatility forecasts and Squared Returns (5-day Rolling window)
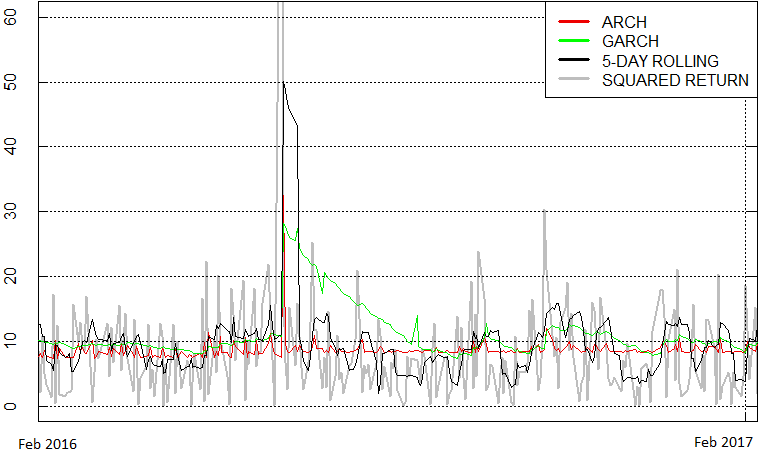
Fig 3

We use two losses traditionally used in the volatility forecasting literature namely the quasi-likelihood (QL) loss and the mean-squared error (MSE) loss. QL depends only on the multiplicative forecast error, whereas the MSE depends only on the additive forecast error. Among the two losses, QL is often more recommended as MSE has a bias that is proportional to the square of the true variance, while the bias of QL is independent of the volatility level. As shown in table 3, GARCH(1,1) has the lowest QL, while the ARCH (1) and rolling variance perform better on the MSE measure.

Table 3: QL & MSE

Table 3 QL and MSE

Table 4: Diebold- Mariano Test (w/5-day Rolling window)
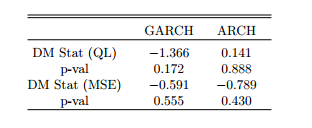
Table 4 DM test

Employing the Diebold-Mariano (DM) Test, we find that there is no significance in the DM statistics of both the QL and MSE. Neither the GARCH nor ARCH are found to perform significantly better than the 5-day Rolling Variance.

Conclusion

In this analysis, we tested various models to forecast the volatility of the Pound exchange rate against the Euro in light of the Brexit referendum. In line with Miletić (2014), we find that despite accounting for volatility clustering through ARCH effects, our models do not fully capture volatility during periods of extremely high uncertainty.

We find that the shock to the exchange rate resulted in a large but temporary swing in volatility but this did not persist as long as predicted by the GARCH model. In contrast, the ARCH model has a very low persistence, and while it captures the temporary spike in volatility well, it quickly reverts to the unconditional mean.  To the extent that we can consider exchange rate volatility as a measure of risk and uncertainty, we may have expected the outcome of Brexit to have a long term effect on uncertainty. However, we observe that the exchange rate volatility after Brexit does not seem significantly higher than before. This may suggest that either uncertainty does not persist (unlikely) or that the Pound-Euro exchange rate volatility does not capture fully the uncertainty surrounding the future of the UK outside the EU.

References

Abdalla S.Z.S (2012), “Modelling Exchange Rate Volatility using GARCH Models: Empirical Evidence from Arab Countries”, International Journal of Economics and Finance, 4(3), 216-229

Allen K.and Monaghan A. “Brexit Fallout – the Economic Impact in Six Key Charts.” www.theguardian.com. Guardian News and Media Limited, 8 Jul. 2016. Web. Accessed: March 11, 2017

Brownlees C., Engle R., and Kelly B. (2011), “A Practical Guide to Volatility Forecasting Through Calm and Storm”, The Journal of Risk, 14(2), 3-22.

Centre for Macroeconomics (2016), “Brexit and Financial Market Volatility”. Accessed: March 9, 2017.

Cox, J. (2017) “Pound sterling falls after Labour slashes Tory lead in latest election poll”, independent.co.uk. Web. Accessed May 26, 2017

Diebold F. X. (2013), “Comparing Predictive Accuracy, Twenty Years Later: A Personal Perspective on the Use and Abuse of Diebold-Mariano Tests”. Dukich J., Kim K.Y., and Lin H.H. (2010), “Modeling Exchange Rates using the GARCH Model”

HM Treasury (2016), “HM Treasury analysis: the immediate economic impact of leaving the EU”, published 23rd May 2016.

Sveriges Riksbank, “Cross Rates” www.riksbank.se. Web. Accessed 16 Feb 2017

Taylor, A. and Taylor, M. (2004), “The Purchasing Power Parity Debate”, Journal of Economic Perspectives, 18(4), 135-158.

Van Dijk, D., and Franses P.H. (2003), “Selecting a Nonlinear Time Series Model Using Weighted Tests of Equal Forecast Accuracy”, Oxford Bulletin of Economics and Statistics, 65, 727–44.

Tani, S. (2017), “Asian companies muddle through Brexit uncertainty” asia.nikkei.com. Web. Accessed: May 26, 2017

Misallocation Dynamics in Europe: Germany versus South

Editor’s note: This post is part of a series showcasing Barcelona GSE master projects by students in the Class of 2016. The project is a required component of every master program.


Authors:

Alexandros Georgakopoulos, Sampreet Singh Goraya, Viraj Rajeev Jorapur, Barrett William Owen, Jurica Zrnc

Master’s Program:

Economics

Motivation:

After the start of the Great Recession in Europe, the countries of the South (e.g. Spain) entered into a protracted stage of negative growth, amounting to an average decline in output of 1.6 perecent between 2008 and 2013, while Germany grew 0.8 percent on average in the same period. Furthermore, the decline in economic growth was accompanied by the under performance of total factor productivity growth in the South (-2.3%) relative to almost stagnant productivity growth in Germany (-0.5%). This points to some underlying factors which are not solely attributable to the demand shocks and the financial crisis.

KEY FINDINGS

Data and Measurement of Misallocation

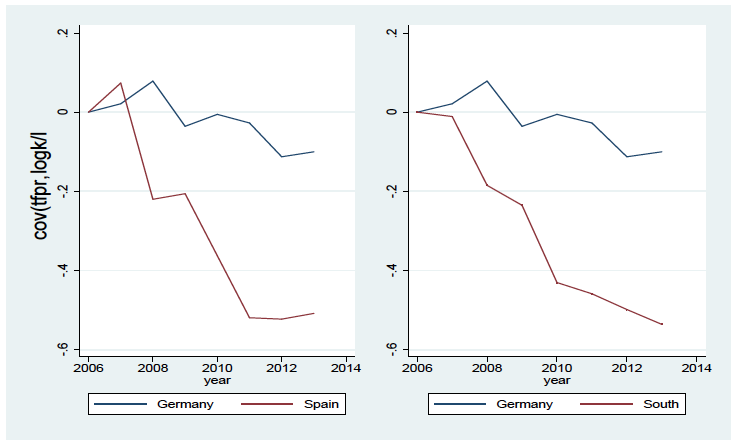
Using a rich firm-level dataset we calculate various dispersion measures of marginal revenue products of production factors. We find that marginal revenue product of capital was increasingly more dispersed in the South, but not in Germany. A large part of this increase can be explained by the weakening link between capital and productivity. This implies that capital was increasingly allocated to less productive firms.

chart
Time-series of covariance between logTFPR and (Logk l) from 2006-2013,
Base year=2006, Amadeus and author’s own calculations

However, we also document increasing dispersion in marginal revenue product of labor, albeit of much smaller magnitude. This points to the possibility of common drivers behind the changes in both meassures. We argue that the common factor might be increased dispersion of TFP shocks during the recession. Similarly to Bloom et al. (2012) we interpret this as an increase in uncertainty. Furthermore, we calculate the potential gains by equalizing marginal revenue products of factors of production across firms in sectors, following Hsieh and Klenow (2007) methodology. Supporting our previous analysis, we find that gains from reallocation of resources increased considerably in the South but remained flat in Germany.

Determinants of Misallocation

In the next section, we explore different determinants of misallocation and relate it to different trends in South and Germany. First, we pool the data for six countries to explore general determinants of misallocation dynamics during the recession. Results point towards the importance of rising uncertainty during the recession, public sector influence and financial frictions in explaining the increase in misallocation during the recession. Furthermore, we find that sectors characterized with more business dynamism experienced more misallocation during the recession. This result is in accordance with Foster et al. (2014) which find that the intensity of reallocation fell rather than rose during the recent financial crisis in the US.

Secondly, we explore the differences between Germany and the South. We find that sectors with larger financial intensity were characterized by higher misallocation in the South, while not in Germany. This points to larger financial frictions in the South being important to explain the increase in misallocation. We find evidence that sectors prone to cronyism saw increased misallocation of capital in the South, while not in the North. We also find some evidence of benefits from product market reforms during recession in the South. We perform a number of robustness checks which generally support our results, although in some specifications, some parameters are not significant.

Brexit: BGSE Community Analysis

We want to know what the BGSE community is thinking and reading about the Brexit.

brexit-624x437

We invite all Barcelona GSE students and alumni to share their early reflections on the potential economic consequences of the UK’s recent vote to leave the EU. Did you focus on a related topic in your master project? Are you working at a think tank, central bank, or consulting firm where your projects will be impacted by this decision? Have you seen any articles or links that you found useful for understanding what lies ahead?

Here are a couple of pieces we’ve found to get the discussion going:

After Brexit: What next for the EMU, EU and UK?
(ADEMU webinar)

The BGSE participates in A Dynamic Economic and Monetary Union (ADEMU), a project of the EU Horizon 2020 Program. Last week, ADEMU researchers held a webinar to discuss the Brexit.

Background:

Europe has grown out of its crises when reason and solidarity have prevailed, but it has also been devastated by its crises when fear and nationalism have taken the lead. Brexit, in the aftermath of the euro crisis, brings this dichotomy back to the foreground. Since 2010 there have been important advances in the development of the Economic and Monetary Union (EMU) and flexible forms of participation have allowed other EU countries, reluctant to join the euro, to share the basic principles that define the EU and have a common presence in the interdependent global world.

According to the panelists, Brexit raises 3 crucial questions:

  1. Should the EMU be accelerated to become a centre of gravity within the EU, or slowed down to avoid a centrifugal diaspora? If accelerated, how?
  2. Should an ‘exit’ country be allowed free entry to the single market and other EU public goods without accepting freedom of movement?
  3. Should the EU remain as it is, or increase its capacity to offer common public services (Banking Union, border security, research funding, environment, etc.), or limit its scope of activity to the EU single and integrated market?

Webinar Panel:
– Joaquín Almunia (Former Vice-President of the European Commission, honorary president of the Barcelona GSE)
– Ramon Marimon (European University Institute and UPF – Barcelona GSE; ADEMU)
– Gorgio Monti (European University Institute; ADEMU)
– Morten Ravn (University College London; ADEMU)

Moderator:
Annika Zorn (European University Institute; Florence School of Banking & Finance)


From Brexit to the Future
(Joseph Stiglitz)

Nobel Laureate and Barcelona GSE Scientific Council member Joseph Stiglitz shares some reflections in the wake of the Brexit decision


What are you thoughts on Brexit?

We want to know what the BGSE community is thinking and reading about the Brexit. Please share your ideas, favorite sources for analysis, or observations from economists you respect in the comments below.

EU Banking Union: What it is and What it is Not

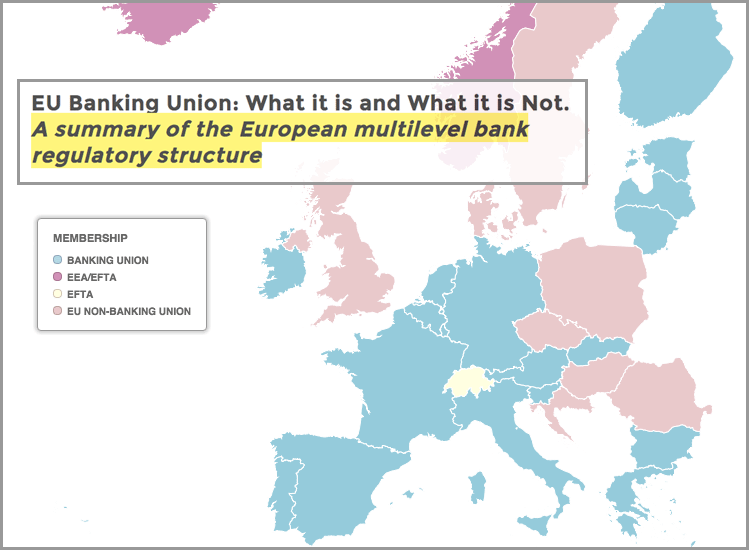
Arturo Pallardó ’15 (Master in Economics) and Christopher Gandrud (Lecturer, City University London) have put together a summary of the European multilevel bank regulatory structure.

banking union

The health of the European banking system has come back into the media spotlight. The recent fall in bank shares; the creation of the Italian “bad bank”; and Britain’s demands to shield its banks from rules governing the euro region; suggest that the debate on the design and functioning of the European banking regulatory architecture will be on the table in the following months.

Given the complex and evolving nature of European banking regulation, there is much confusion about what has already been established and what plans are being discussed. We hope to clarify the current and proposed state of the European bank regulatory architecture. We differentiate which rules and institutions form the so-called “banking union” and which rules are part of the more general EU single market for financial services.

You can read the full summary on bankingunion.eu, a website run by Arturo that curates content and fosters debate on the European banking union’s evolution.

Follow the authors on Twitter @bankingunion_eu and @chrisgandrud


New banking union website by Arturo Pallardó ’15

Economics alum Arturo Pallardó ’15 has created a new website to follow the evolution of the European banking union.

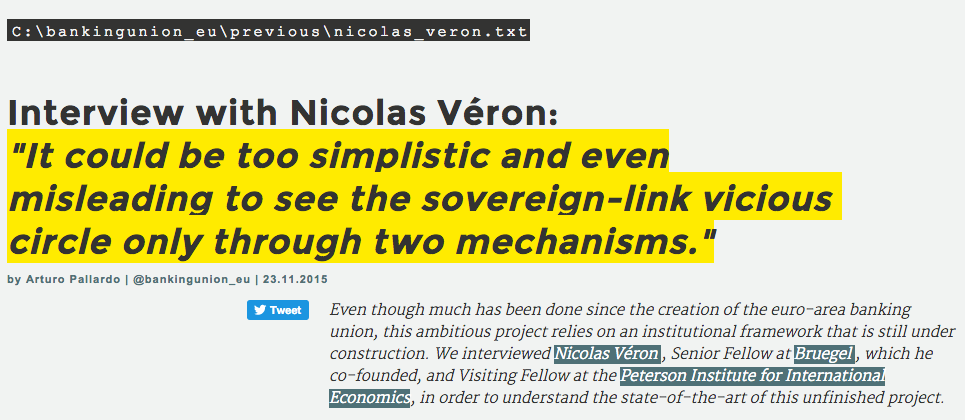
Arturo Pallardó (Master in Economics ’15) is the creator of the @bankingunion_eu Twitter account and has just launched a new website to follow the evolution of the European banking union. Here he tells Barcelona GSE Voice readers about the project:
interview-bankingunion

As expressed by the European Central Bank, the construction of a banking union emerged from the financial crisis of 2008 and the subsequent sovereign debt crisis: “It became clear that, especially in a monetary union such as the euro area, problems caused by close links between public sector finances and the banking sector can easily spill over national borders and cause financial distress in other EU countries”.

However, this European project is still under construction. The ultimate goal of this www.bankingunion.eu website is to gather and structure banking union-related documents, from legislative acts to research papers, while fostering the debate on those issues that are unfinished.

Meanwhile, in the current beta version of the web the reader will find different interviews with academics, researchers and professionals discussing some of these banking union topics.

alumni

Visit www.bankingunion.eu

Follow @bankingunion_eu on Twitter

Connect with Arturo on LinkedIn

Greek Banks in the Headlines (Link Roundup) | Daily Updates

Evolution of news about Greek banks. Curated by @BankingUnion_eu (current student in the Master in Economics).

5 FEB

ECB collateral damages on Greece (Bruegel)

Greek banks will not have any liquidity problems, JP Morgan report‏ (Intelligent News)

Q&A: The ECB’s warning shot to Greece (Financial Times)

ECB turns off the taps, but Greek banks can still get funding (Open Europe)

Levine on Wall Street: Bearer Bonds and Greek Banks (BloombergView)

Greek banks hit after ECB snub, Athens rejects ‘blackmail’ (Reuters)

What are the implications of the ECB’s decision for Greek banks? (Macropolis)

Emergency Liquidity Assistance for Greek Banks: Explainer (BloombergBusiness)

What the ECB’s Move on Greek Government Debt Is Really All About (BloombergBusiness)

What you need to know about ECB’s Greek collateral decision (MarketWatch)

Eligibility of Greek bonds used as collateral in Eurosystem monetary policy operations (ECB Press Release)

4 FEB

European Central Bank resists latest Greek bailout plan (FT)

ECB set to back further liquidity assistance for Greek banks -paper (Reuters)

Greeks Spooked by Debt Clashes Put Cash Under Bathroom Tiles (Bloomberg)

ECB Readies Lifeline for Greek Banks (Handelsblatt)

The state of play with Greek banks’ liquidity (Macropolis)

3 FEB

Exclusive – Three Greek banks tap two billion euros in emergency funding: sources (Reuters)

Greek banks lifted by Syriza debt plan (FT)

First Germany, Now ECB Rejects “Latest Greek Bailout Plan” (Zero Hedge)

1 FEB

So Whose Problem Is Greek Debt, Anyway? (Forbes)

Greece Asks ECB to Keep Banks Afloat, Tsipras Pitches Deal (Bloomberg)

For Greece, Bank Trouble Looms Again as New Government Takes Shape (The New York Times)

What’s Going On with Greece and the ECB? (Medium)

31 JAN

ECB’s Liikanen – No lending to Greek banks if no deal by end of February (Reuters)

Greek Banks May Lose ECB Credit, Says Policy Maker Liikanen (The Wall Street Journal)

30 JAN

Greek bank debt plummets as investors head for the exit (Reuters)

Six things you need to know about Greek banks (CapX)

Europe’s Greek Test (The New York Times)

Greece Sets Up Cash Crunch for March Telling EU Financial Bailout Is Over (Bloomberg)

How Greece Can Run Out of Cash and What ECB’s Draghi Can Do (Bloomberg)

S&P warns on Greek banks (FT)

Greece’s New Government Is About To Start Debt Negotiations With Its Eurozone Partners (Business Insider)

29 JAN

Greek Markets Buckle. New Coalition Government Fans Investors’ Fears of Eurozone Exit (The Wall Street Journal)

Greek Bank Shares Edge Back Up Off Record Lows (The New York Times)

Greek banks find support after fall (FT)

Greek bank crisis leaves time short to strike debt deal (FT)

Greek Markets Steady as Banks Rebound (The Wall Street Journal)

Greek Banks Are Ticking Time Bombs (Bloomberg)

Greek bank deposits fall as pre-election tensions rise (Reuters)

Greek Bank Deposit Flight Said to Accelerate to Record (Bloomberg)

Greek Banks at Mercy of the Fates (The Wall Street Journal)

Greek Bonds Halt Slide as Banks Rally; Ireland Borrows for Free (Bloomberg)

Greek banks rebound amid debt talk hopes (The Telegraph)

28 JAN

Greek banks lose €8bn in three days since Syriza victory as liquidity crisis feared (The Telegraph)

Greek Stocks Crash, Bonds Plummet, Banks Have Worst Day Ever (Zero Hedge)

Thinking About the New Greek Crisis (The New York Times)

Greek Banks Have Just Lost A Third Of Their Value — Here’s Why (Forbes)

Greek banks are getting shattered (Business Insider)

Greek banks extend slide to peg back European shares (Reuters)

Greek bank stocks hit record lows after leftist poll win (Reuters)

Greek banks plunge as new government challenges bailout (CNN)

Now We ‘Know’ Greek Banks Are Really In Trouble (Zero Hedge)

ECB Supervisor Nouy Says Greek Banks Strong Enough to Survive (Bloomberg)

Renewed plunge in Greek banks hits European shares (Reuters)

Greek bank stocks and deposits hit by default fears (CNBC)

$11 Billion Wiped From Greek Banks on Nationalization Threat (Bloomberg)

France and Italy: The ABCs of the European fiscal framework

Barcelona GSE grad Alvaro Leandro looks at the EU’s Stability and Growth Pact through the lens of the draft budget plans of France and Italy.

alumni

The following post by Alvaro Leandro (ITFD’13 and Economics ’14) has been previously published by Bruegel.

Mr. Leandro is Research Assistant at Bruegel in Brussels, Belgium.


The EU’s fiscal framework, the Stability and Growth Pact (SGP), is a complicated system of fiscal rules. Rather than trying to assess the virtues and failures of the SGP, this blogpost aims at understanding its complex rules through the lens of the draft budget plans of France and Italy. France is in the corrective arm of the SGP, while Italy is now in the preventive arm, which allows the examination of various SGP requirements, such as the

  • structural balance pillar,
  • expenditure balance pillar,
  • and the debt criterion

which apply to countries in the preventive arm (like Italy), and the

  • headline budget deficit criterion,
  • the structural balance criterion,
  • and the cumulative structural balance criterion

which apply to countries in the corrective arm (like France). We also discuss the rules regarding financial sanctions.

On 28 November 2014, the European Commission released its opinions on the euro area Member States’ Draft Budgetary Plans for 2015. The purpose of these opinions is to assess each country’s compliance with the SGP, and to recommend appropriate action if there are risks of non-compliance.

Both Italy and France are “at risk of non-compliance with the provisions of the Stability and Growth Pact”

One of the surprises was that, in the case of Italy and France (as well as Belgium), the Commission decided to postpone its recommendations until March 2015, “in the light of the finalisation of the budget laws and the expected specification of the structural reform programmes announced by the authorities“. Both Italy and France are “at risk of non-compliance with the provisions of the Stability and Growth Pact”, according to the Commission.

The Framework

The Stability and Growth Pact is composed of a preventive and a corrective arm. The corrective arm is called the Excessive Deficit Procedure (EDP), which is triggered for countries with a general government deficit larger than 3 percent of GDP or with debt larger than 60 percent of GDP not being reduced at a satisfactory pace. France is currently under the corrective arm and Italy was as well until 2013. Italy is therefore now subject to the rules of the preventive arm.

Source: Country Stability and Convergence Programmes for MTOs, AMECO for forecast of 2014 and 2015 Structural Balances

Notes: Data labels are for the MTOs. According to the Treaty on Stability, Coordination and Governance (TSCG), signed by all euro area members in March 2012, all signatory Member States must have an MTO higher than -0.5% of GDP (or -1% for countries with a debt/GDP ratio lower than 60%). The “fiscal” part of the TSCG is often called the ‘Fiscal Compact’.

The fundamental variables used to assess compliance with the preventive arm of the SGP are the country-specific medium-term budgetary objectives (MTOs), which are defined as structural balances (a measure of the government budget balance adjusted for the economic cycle and one-off revenue and expenditure items; this blog post by Zsolt Darvas explains the estimation methodology and why it has some drawbacks). MTOs are chosen by each Member State following strict guidelines set out by the Commission, in order to ensure sustainability in its public finances (a higher MTO is required from countries with a high debt ratio or with a rapidly-ageing population faced with increasing age related expenditure for example, while the ‘Fiscal Compact’ limits the MTO for euro area member states, see the notes to Figure 1). A few examples of MTOs can be found in Figure 1: France, Italy and Spain have an MTO of 0 percent of GDP, while Germany’s MTO is -0.5 percent. This means that in the case of Germany, for example, a structural deficit of 0.5 percent of GDP is deemed enough to ensure the sustainability of its public finances.

The Fiscal Compact is not binding for non-euro area Member States, which therefore have more freedom in setting their MTOs. For example, Hungary has an MTO of -1.7 percent, the Polish and Swedish MTO is -1 percent, while it is zero for the United Kingdom.

To comply with the preventive arm of the SGP, all Member States must be at their MTOs or be on a path to reach them, with an annual improvement of their structural balance of 0.5 percent of GDP towards the MTO as a benchmark.

A higher effort might be required for countries with high debt/GDP ratios and pronounced risks to overall debt sustainability. A higher effort is also required in good economic times, and a lower effort in economic downturns. A Member State could also be allowed to deviate from the adjustments if it experiences “an unusual event outside its control with a major impact on the financial position of the general government”.

Therefore compliance with the preventive arm is not defined by the Member State’s structural balance, but by its path towards the MTO.

Italy

Structural balance pillar: Table 1 shows the recommended path for Italy. On the 28th of November 2014 the Commission decided that “severe economic conditions” (namely a real GDP contraction and a large negative output gap: see Table 3) justified that Italy is not required to adjust its structural balance towards the MTO by the 0.5 percent of GDP benchmark in 2014. This is why the required change in the structural balance for 2014 is 0. Italy had originally planned a large correction of its structural budget for 2014 in its 2013 Stability Program, of 0.7 percentage points. In its Draft Budget Plan for 2014 Italy revised this adjustment to 0.3. Finally it invoked Article 5 of Regulation 1175/2011 in its 2014 Stability Program which allows a deviation from the required adjustment “in the case of an unusual event outside the control of the Member State concerned which has a major impact on the financial position of the general government”. The required adjustment is also 0 in 2013 for the same reason: negative real output growth makes Italy eligible to the escape clause. In 2015 real GDP is forecast by the Commission to increase by 0.6 (see Table 3), which means that Italy can no longer apply for the escape clause regarding economic downturns.

Source: Commission Staff Working Document: Analysis of the draft budgetary plan of Italy (28 November 2014), European Commission Autumn Forecast (November 2014), Italy’s Stability Programme April 2014, Italy’s Stability Programme April 2013, Vade Mecum on the Stability and Growth Pact (May 2013)

Note: ΔSB denotes the percentage point change in the structural balance. MLSA: minimum linear structural adjustment. DBP: draft budget plan

(1): Deviation of the growth rate of public expenditure net of discretionary revenue measures and revenue increases mandated by law from the applicable reference rate in terms of the effect on the structural balance. A negative sign implies that expenditure growth exceeds the applicable reference rate.

Expenditure balance pillar: Member States in the preventive arm of the SGP also have to comply with the expenditure benchmark pillar, which complements the structural balance pillar. It requires countries that are not at their MTO to contain the growth rate of expenditure net of discretionary revenue measures to a country-specific rate below that of its medium-term potential GDP growth. This medium-term potential GDP growth is calculated as a 10-year average (of the 5 preceding years, the current year and forecasts for the next 4 years), and in the case of Italy it is 0 percent in 2014 and 2015. Had Italy been at its MTO it would have had to contain net expenditure growth to 0 percent. However, not being at its MTO, it is required to contain net expenditure growth to a reference rate below medium-term potential GDP growth: -1.1 percent in 2015 (which is calculated so that it is consistent with a tightening of the budget balance of 0.5 percent of GDP when GDP grows at its potential rate). The applicable reference rate in 2014 is 0 because of the “severe economic conditions”. In 2013 the applicable reference rate was 0.3, which is different to that in 2014 and 2015 because it is revised every three years. The commission allows one-year and two-year average deviations of a maximum of 0.5 pp of GDP in terms of their impact on the structural balance. In 2015 the deviation in terms of its effect on the structural balance is forecast to be of 0.7 pp. of GDP, which is a deviation larger than the allowed 0.5 pp.

Debt Criterion: Countries which have recently left the EDP are subject to a 3-year transition period aimed at ensuring that the debt level is being reduced at an acceptable pace. Italy is in such a transition period, since it left the EDP in 2013. It is thus subject to required medium-term linear structural adjustments (MLSAs) aimed at ensuring that it will comply with the debt criterion. These MLSAs are formulated in terms of adjustments to the structural balance. Since Italy is in the preventive arm and therefore also subject to required adjustments towards the MTO, the largest one is applicable. The 2.5 pp. MLSA in 2015 (larger than the 0.5 pp. required change under the preventive arm) is at serious risk of not being met according to Commission forecasts. This violation of the debt criterion could lead to a reopening of the Excessive Deficit Procedure.

Commission’s view: In its opinion on Italy’s Draft Budget Plan released at the end of November 2014, the Commission points to risks of non-compliance with the requirements of the SGP, and “invites the authorities to take the necessary measures […] to ensure that the 2015 budget will be compliant with the Stability and Growth Pact”. It then says that “The Commission is also of the opinion that Italy has made some progress with regard to the structural part of the fiscal recommendations issued by the Council in the context of the 2014 European Semester and invites the authorities to make further progress. In this context, policies fostering growth prospects, keeping current primary expenditure under strict control while increasing the overall efficiency of public spending, as well as the planned privatisations, would contribute to bring the debt-to-GDP ratio on a declining path consistent with the debt rule over the coming years.”

France

Once a country has been identified as having an excessive deficit, which was the case for France in 2009, it is turned over to the corrective arm, the EDP, the purpose of which is to correct such a deficit.

Headline budget deficit criterion: Once a country has been identified as having an excessive deficit, which was the case for France in 2009, it is turned over to the corrective arm, the EDP, the purpose of which is to correct such a deficit. France has now been under the EDP for 5 consecutive years, and is subject to requirements set out in the latest Council recommendation to end the excessive deficit situation (June 2013). The recommendation released in 2009 originally planned a correction of the deficit (below 3 percent) by 2012, which was then postponed to 2013 in view of the actions taken and the “unexpected adverse economic events with major unfavourable consequences for government finances”. In June 2013, the Council again postponed the correction of the deficit to 2015 for the same reasons: France fell slightly short of the required 1 percent average annual fiscal effort for the period 2010-2013 (the actual average annual fiscal effort was 0.9 percent), but this was again against a backdrop of “unexpected adverse economic events”.

Source: Commission Staff Working Document: Analysis of the draft budgetary plan of France (November 28, 2014), Council recommendation to end the excessive deficit situation (June 2013), European Commission Autumn Forecast (November 2014)

Note: ΔSB denotes the percentage point change in the structural balance


The latest Council recommendation (June 2013) sets out a path for France’s headline government balance, which you can see in Table 2. By 2015, the headline balance should be reduced to -2.8 percent of GDP. The forecast headline balance of -4.5 percent falls significantly short of this requirement.

Structural balance criteria: Additionally the adjusted change in the structural balance from 2014 to 2015 is forecast to be of 0.0 pp., and its cumulative change from 2012 to 2015 is forecast to be 1.6 pp., falling short of the requirements of 0.8 pp. and 2.9 pp. respectively (1). The structural budget also deviates from the requirements for 2014.

Commission’s view: Thus France is “at a risk of non-compliance” with the SGP, and, contrary to Italy, the Commission “is also of the opinion that France has made limited progress with regard to the structural part of the fiscal recommendations issued by the Council […] and thus invites the authorities to accelerate implementation”. In his letter to the President of the European Commission, France reiterated its determination to go ahead with reforms, most notably in the labour market. It remains to be seen whether progress by March 2015 will be assessed to be sufficient by the Commission.

Source: European Commission Autumn Forecast (November 2014), AMECO database (November 2014)

(*): year-on-year percentage changes

(**): as a percentage of potential GDP

Table 3: France and Italy: main macroeconomic indicators in 2014 and 2015

Sanctions

Non-compliance with the SGP can lead to sanctions. In the preventive arm, a Council recommendation which is not respected can lead to an interest-bearing deposit of 0.2 percent of GDP. A euro-area country in the corrective arm of the SGP may be required to make a non-interest bearing deposit until the deficit has been corrected, after which it can also be sanctioned with a fine worth up to 0.5 percent of GDP (with a fixed component of 0.2 percent of GDP and a variable component (2)). France and Italy are both at a risk of non-compliance with the requirements of the SGP. Failure to meet the required efforts in terms of fiscal consolidation and structural reforms by March 2015 could bring them closer to possible sanctions, unless the flexibility of the SGP is stretched further. Recent growth and inflationary figures suggest continued weak economic activity, and if economic data of 2014 qualified for “severe economic conditions”, 2015 may qualify too, especially if growth and inflation will disappoint relative to the November 2014 ECFIN forecasts. And in the preventive arm, structural reforms which have a verifiable positive impact on the long-term sustainability of public finances (such as by raising potential growth) could be considered when assessing the adjustment path to the medium-term objective.

Notes:

(1) The adjusted changes in the structural balance correct for the negative impact of the changeover to ESA 2010 as well as for changes in potential growth and revenue windfalls/shortfalls.

(2) This variable component is equal to “a tenth of the absolute value of the difference between the balance as a percentage of GDP in the preceding year and either the reference value for government balance, or, if non-compliance with budgetary discipline includes the debt criterion, the government balance as a percentage of GDP that should have been achieved in the same year according to the notice issued”

Young and under pressure – Europe is risking a lost generation

The following post by Olga Tschekassin ’13 (Master in International Trade, Finance and Development) has been previously published by the World Economic Forum and Bruegel

Ms. Tschekassin is Research Assistant at Bruegel in Brussels, Belgium. Follow her on Twitter @OlgaTschekassin


Since the beginning of the global financial crisis, social conditions have deteriorated in many European countries. The youth in particular have been affected by soaring unemployment rates that created an outcry for changes in labour market policies for the young in Europe. Following this development, the Council of Europe signed a resolution in 2012 acknowledging the importance of this issue and asking for implementation of youth friendly policies in the Member States. Yet, almost 5.6 million young people were unemployed in 2013 in the European Union (EU) – in nine EU countries the youth unemployment rate more than doubled since the beginning of the crisis.

Today I want to draw your attention to two more indicators reflecting the social situation of the young generation: the percentage of children living in jobless households and the percentage of young people that are neither in employment nor education nor training.

Children in jobless households

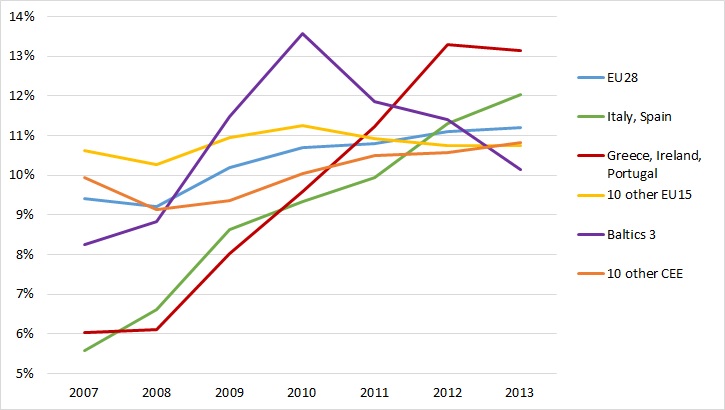
The indicator Children in jobless households measures the share of 0-17 year olds as a share of the total population in this age group, who are living in a household where no member is in employment, i.e. all members are either unemployed or inactive (Figure 1).

Figure 1: Children in jobless households

Source: Eurostat and Bruegel calculations. Country groups: 10 other EU15: Austria, Belgium, Denmark, Finland, France, Germany, Luxembourg, Netherlands, Sweden and United Kingdom; Baltics 3: Latvia, Lithuania, Estonia; 10 other CEE refers to the 10 member states that joined in the last decade, excluding the Baltics: Bulgaria Czech Republic, Croatia, Hungary, Poland, Romania, Slovenia, Slovakia, Cyprus and Malta; Sweden: data for 2007 and 2008 is not available, the indicator is therefore assumed to evolve in line with the other 9 EU15 countries. Such approximation has only a marginal impact on the aggregate of the other EU15 countries, because children in jobless HHs in Sweden represented only 3% of the country group in 2009. Countries in groupings are weighted by population.

In the EU28 countries this share rose only slightly over the past years to 11.2%. It is striking, however, that the ratio of children living in households where no one works more than doubled in the euro-area programme countries (Greece, Ireland, Portugal) as well as in Italy and Spain to 13% and 12%, respectively. And even more shocking – while the share stabilized in the programme countries, in Italy and Spain it is still sharply increasing. In Ireland in 2013 more than one in every six children lived in a household where no one worked. This is indeed an alarming development. Only the Baltics, which experienced a very deep recession among the first countries hit by the crisis, are reporting a sizable turning point in the statistic in 2010 and the share is presently continuing to decline. The numbers are, however, still well above pre-crisis levels.

A high share of children living in jobless households is not only problematic at the moment but can also have negative consequences for the young people’s future since it often means that a child may not only have a precarious income situation in a certain time period, but also that the household cannot make an adequate investment in quality education and training (see a paper on this issue written for the ECOFIN Council by Darvas and Wolff here). Therefore a child’s opportunities to participate in the labour market in the future are likely to be adversely affected. Moreover, as I discussed in a blog earlier this year, children under 18 years are more affected by absolute poverty than any other group in the EU and the generational divide is widening further.

Not in Education, Employment or Training (NEET)

The financial situation of young people between 18 and 24 years old who finished their education is less dependent on their parents income because they usually enter the labour market and generate their own income. Therefore we are going to have a closer look on their work situation, i.e. how many young people have difficulties participating in the labour market.

Figure 2:  Not in Education, Employment or Training
Figure 2: Not in Education, Employment or Training

Source: Eurostat and Bruegel calculations. Country groups as in previous chart

The NEET indicator measures the proportion of young people aged 18-24 years which are not in employment, education or training as a percentage of total population in the respective age group. We can see in Figure 2 that the situation among EU28 countries stabilized over the last four years. The good news is that for the first time since 2007 we see a decline in the rate in the euro-area programme countries in 2013. This decline is, however, mostly driven by Ireland with an unchanged situation in Greece and Portugal. Also, in the Baltics the ratio is on a downward trend. More worrying, however, is the situation in Italy and Spain. Among all EU28 countries, the young generation in Italy with 22.2% of all young people being without any employment, education or training, is disproportionately hit by the deterioration in the labour market. Every fifth young person between 18 and 24 is struggling to escape the exclusion trap. Europe and especially Italy is risking a lost generation more than ever.

Labour market policies for young people should therefore stand very high on the national agendas of Member States. The regulations introduced in summer 2013 into the Italian labour market reform which are setting economic incentives for employers to hire young people build an important step towards more labour market integration of the youth in Europe. Their effects are yet to be observed in the employment statistics in the coming years in Italy. More action on the national and European level is needed to improve the situation of the young.

Europe out of balance: an analysis of current accounts in Europe

Editor’s note: This post is part of a series showcasing Barcelona GSE master projects by students in the Class of 2014. The project is a required component of every master program.


Europe out of balance: an analysis of current accounts in Europe

Author:

Michel Carlo Nies

Master Program:

Economics

Paper Abstract:

The European sovereign debt crisis should not only be seen as the simple failure to manage public finances, but also as the consequence of divergent balance of payment positions. This paper attempts to shed light on this line of argument by analysing empirically the determinants of current accounts. The principal conclusion is that divergent developments in labour costs and misallocation of capital are behind the developments that led to the sovereign debt crisis. Given these results, this paper also evaluates different policy measures designed to address the issue of diverging current accounts.

Read the full paper or view slides below:

[slideshare id=39413120&doc=europe-current-accounts-140923033450-phpapp02]