 Evan Seyfried ’16 shares the following summary of a talk given by Princeton’s Atif Mian this May to the UPF Department of Economics and Business. Follow Evan on Twitter @evanseyf
The bubble
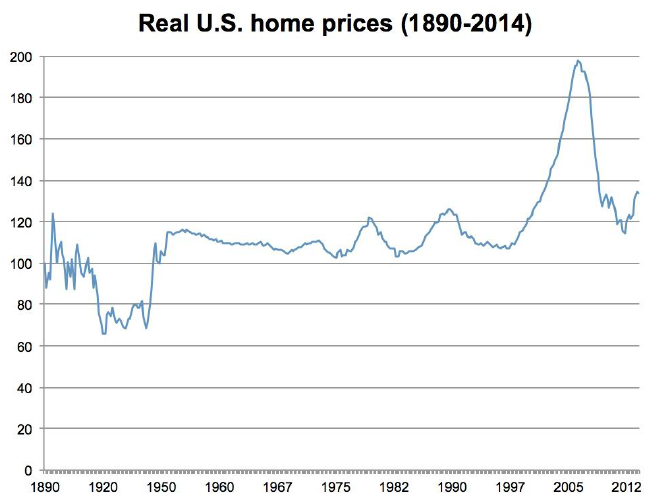
In 2006, house prices in the U.S. reached their all-time peak. The S&P/Case-Shiller Housing Price Index had doubled in just eight years (not accounting for inflation).1 The year before, Robert Shiller (whose work on historical housing prices led to the creation of the Case-Shiller Index) had published an update to his book Irrational Exuberance warning that recent growth in housing prices was historically unprecedented—he argued that houses were wildly overpriced and would likely revert back to a relatively constant historical value in the long run.2 His research showed that if you looked at real prices (inflation-adjusted) in the U.S. housing market prior to the early 2000s bubble, you would find that prices have not changed much since 1890!

The frenzy of the early 2000s finally caught up with lenders, homeowners, and investors, who began to doubt the continued rise of house prices. In late 2005, with interest rates rising, a growing number of homeowners with Adjustable-Rate Mortgages (ARM) began to default on their mortgages. Finally, by the end of 2006 the housing bubble began to collapse under its own weight, and the shockwaves ripped through the financial sector—which had bet heavily on the U.S. housing market through mortgage-backed securities and newer exotic financial instruments. French bank BNP Paribas, on August 7, 2007, famously suspended withdrawals from its investment funds associated with subprime mortgages, a move that triggered a shadow banking run, and is often considered the official start of the financial crisis—when the housing market instability truly began to upend the financial sector. What followed was the most severe financial crisis since the Great Depression and a long recession for the rest of the U.S. economy.
But there is still much to be learned about the interaction of the housing bust (leaving many homeowners with very high debt compared to their assets), the crisis in the financial sector (wherein banks have been generally unwilling to either extend new credit or restructure existing loans), and the continuing economic malaise in the U.S. and other economies around the world.
From the housing bubble to household debt
A great deal of Princeton economist Atif Mian’s research—much of it in collaboration with University of Chicago economist Amir Sufi—has studied these interactions, exploring the fallout from the housing bubble in the U.S. and the subsequent “debt overhang.”
What is household debt overhang?
Imagine a family owes $200,000 on their mortgage. If the market crashes and the house value suddenly declines to $180,000, then the family now owes $20,000 more than the value of their house. Thus, even if the family chooses to sell the house, they will not be able to pay back the mortgage in full. This is also called being “underwater” on a mortgage. In the context of all household finances, debt overhang is a similar concept to being underwater, and refers to the amount of indebtedness of a family beyond the value of their assets, taking into account their anticipated income. Debt overhang makes a household unattractive to lenders (both for new loans and for refinancing old loans), because they do not have any collateral that is not already used to cover existing debt.
Note that household debt is treated separately from other private sector debt (mainly non-financial firm debt), and shows notably different dynamics. All of Atif Mian’s research mentioned here focuses specifically on household debt.
In 2013, Mian published evidence that poorer families who were highly leveraged in the housing market reacted very sharply to the loss of wealth when their homes depreciated following the housing bust. Because their marginal propensity to consume out of housing wealth (how much families spend knowing that they have a certain amount of wealth in their house to fall back on) is higher than for middle- or upper-income families, their consumption dropped disproportionately in the years after the bubble.4 Of course, at the individual level this behavior is rational, but at the national level low consumption growth in a demand-constrained economy has created a negative feedback loop of lower job growth, lower income growth, and a further drop in consumption growth.
One of the takeaways from this body of research is that governments and international finance organizations need to do a better job of properly accounting for how private sector debt affects consumption. Optimistic forecasts for recovery from the 2008-2010 Great Recession did not sufficiently account for depressed demand as homeowners and those with credit card and student debt eschewed consumption to deleverage themselves. In a comment on Karen Dynan’s research on household debt overhang and consumption, Mian wrote: “… macroeconomic policy in a world where consumption is driven by debt overhang needs to be seen through its implications for the net worth of the borrowing households.”5
Imperfect instruments?
But Mian also wanted to take these insights from the Great Recession and ask more fundamental questions about private debt and predictions of economic growth: Was consumption affected similarly affected during other periods of high household debt? Do we see similar household debt effects in other countries? If so, how does this extra drag on consumption affect how economists forecast economic growth?
Mian recently gave a lecture at the Universitat Pompeu Fabra in Barcelona, presenting the findings from his attempt to answer those questions. (The working paper, coauthored with Amir Sufi and Emil Verner, is available from the National Bureau of Economic Research.6 ) They took a sample of 30 countries (mostly advanced economies) and compiled private debt data back to 1960. Then they identified shocks to household credit and looked at the relationship between those shocks and subsequent GDP growth. (In this context, shocks should be thought of as sudden increases in the availability of credit.)
Initially they found that high growth in household credit was predictive of subsequent low GDP growth. But they needed to identify the nature of those credit shocks to find possible causal channels. According to Mian they wanted to “rule out demand-driven shocks.” Demand-driven shocks come from the consumer side and could be an increase in the use of credit to smooth lifetime consumption, or as an “insurance effect” to get liquidity today due to uncertainty or an expectation of economic shocks tomorrow. On the other hand, a supply-driven credit shock would be banks extending more and more credit due to government policy changes or financial innovation.
The first demand-driven possibility is relatively simple to disprove. Because the Permanent Income Hypothesis suggests that households borrow today in the expectation of higher future income, the fact that household debt increases should be indicative of economic growth. As mentioned before, Mian, Sufi, and Verner find the exact opposite relationship. The second demand-driven possibility is unlikely because much of the growth in household debt across all the countries in the survey is in mortgage debt, which is generally not taken on to provide liquidity.
Next, they looked into the supply-driven credit shock mechanism and tried to find a way to overcome the presumably endogenous relationship between credit supply shocks and subsequent lower GDP growth. The mechanism must explain why people borrow in the first place, especially what causes them to over-borrow (what Mian calls an “aggregate demand externality”—an effect that spills over to other borrowers), and explain why excessive borrowing actually leads to a decline in real output (what Mian calls “macro frictions” that generate the slowdown, such as monetary policy and “wage rigidity”). As the authors write in the paper: “The key ingredient in this model is an aggregate demand externality that is not properly internalized by borrowing households at the time they make their borrowing decision.”
Two problems remained. First, the authors had to come up with a measure of “credit supply shocks” that could apply to dozens of different countries. Second, they had to choose a measure that could help identify the causal relationship, not just the correlation. Their solution was to use one measure for the U.S. (share of debt issuance by risky firms) and a simpler one for non-U.S. economies (the spread of sovereign debt yields compared to equivalent U.S. Treasury notes). According to Mian, these are “not instruments in the usual sense of the word” (which must satisfy the requirements of independence from the outcome variable and relevance to the explanatory variable). Rather, they are “imperfect instruments” (see Nevo and Rosen, 2012.7 for more information) and, per Mian, “as long as we can sign the covariance of the instrument, we can partially identify the range in which the coefficient lies.” In other words, because these proxies for credit supply shocks typically signify expectations of good times, then if we see that they actually predict bad times, we can at least identify a range of values for how strong the link is between an increase in household debt and subsequent low growth.
The methodology is admittedly complex, and audience members had some reservations about how the authors had dealt with household debt (particularly since household debt is mostly mortgage debt). One audience member suggested that housing bubbles could be the main driver of subsequent low growth, with the extension of credit simply a side effect. Mian acknowledged that he cannot outright reject this concern, but added that the results are robust to controls for house prices, so the bubbles should be controlled for. Another audience member suggested that this could be tested for if the data set included any countries which had seen a credit boom with no attendant housing bubble. There are, in fact, some countries in the data set, but, as Mian stressed, there was not enough of a subsample for a strong statistical test of this hypothesis.
Onward to global growth!
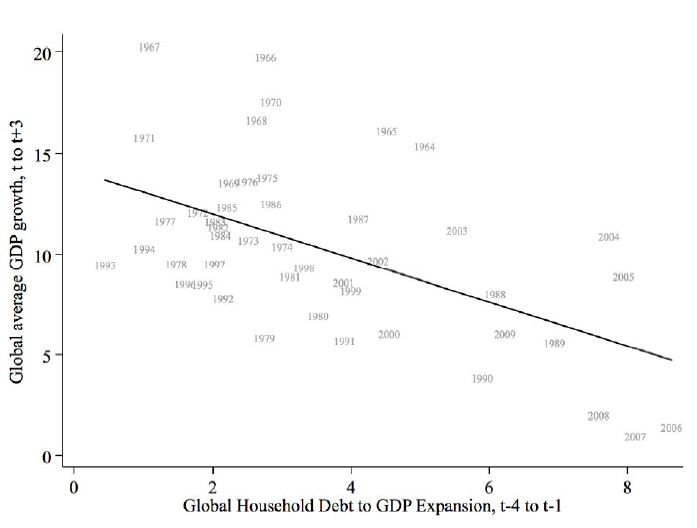
After presenting the “within country” results—showing that household credit supply shocks tended to lead to lower growth in the five or so years following—Mian pivoted to the global portion of the paper. The goal here was to establish the spillover effects of these credit supply shocks among different countries. Sure enough, Mian stated that “the global cycle is more destructive” due to financial spillovers between countries. Because the growth slowdown in a given country after the credit shock leads to a reduction in imports, the problem is transferred to that country’s trading partners. Furthermore, the effects are exacerbated by “macro frictions,” especially in countries that employ fixed exchange rate regimes, borrow primarily in foreign currency, and are near the zero interest rate lower bound (although recently the zero interest rate bound has been proving not to be much of a hard bound after all). Figure 2 shows these global aggregate effects.

Mian stressed that these dynamics between debt and growth, especially the global ones, should be seen as relatively recent (“last-forty-years effects”) side effects of globalization and the financialization of household debt. He concluded that governments must respond to these powerful forces with targeted macroprudential policies, and forecasters at organizations like the IMF and OECD must learn to better account for household debt in their growth projections.
References
- S&P Dow Jones Indices LLC. S&P/Case-Shiller U.S. National Home Price Index [CSUSHPINSA]. FRED, Federal Reserve Bank of St. Louis.
- Shiller, Robert J. 2005. Irrational exuberance. Princeton, N.J.: Princeton University Press.
- Thomspon, D. 2014. “How Did Canada’s Middle Class Get So Rich?” The Atlantic. April 22, 2014.
- Mian, Atif R. and Rao, Kamalesh and Sufi, Amir. 2013. “Household Balance Sheets, Consumption, and the Economic Slump.” Chicago Booth Research Papers. No. 13-42; Fama-Miller Working Paper.
- Dynan, K. 2012. “Is Household Debt Overhang Holding Back Consumption?” Brookings Papers on Economic Activity. Spring 2012.
- Mian, A., Sufi, A., and Verner, E. 2015. “Household Debt and Business Cycles Worldwide.” NBER Working Papers. Working Paper No. 21581.
- Nevo, A., and Rosen, A. 2012. “Inference with imperfect instrumental variables.” Review of Economics and Statistics.


 by
by 


