Charlie Thompson ’14 (ITFD) has built an RStats dashboard that tracks COVID-19 cases in the United States at the county level using the latest data from The New York Times.
Check it out to see how US communities are “flattening the curve”:
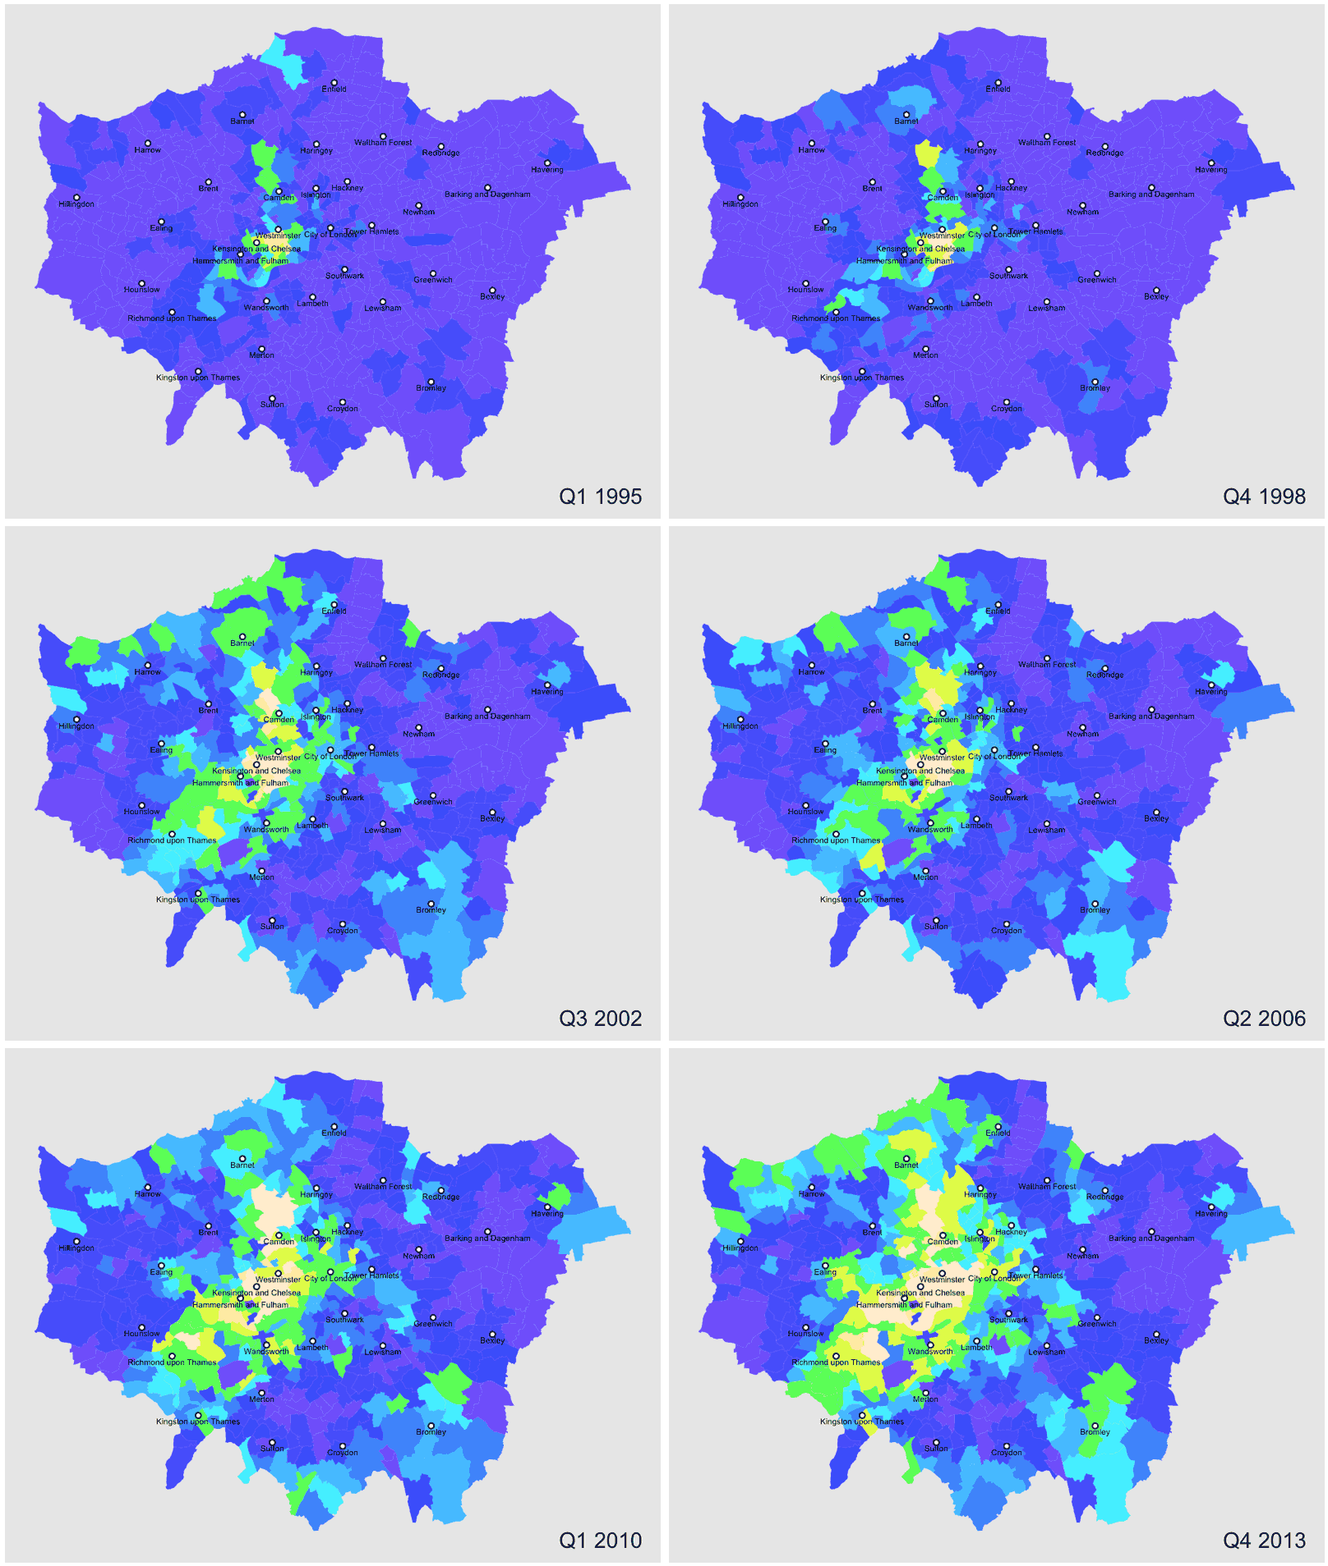
London property prices: Visualising the evolution of the residential market (1995 to 2013)
The London residential property market has always been strong. However, it is only in the last twenty years or so that property prices have increased to such levels that previously “cheap” areas have now turned into prime locations. The gentrification process, together to an increase in population, have pushed up the prices even in peripheral areas. The purpose of this exercise is to visualise these changes, covering the period 1995-2013.
Evolution of local average prices by quarter for the whole period 1995-2013
We use our own and third-party cookies to ensure the website works properly, measure usage, and improve our services. You can accept all cookies, reject non-essential cookies, or configure your preferences. Cookie policy
Configure cookies
Required for the website to work correctly. They cannot be disabled from this panel.
Help measure site usage and improve its content.
Allow advertising, campaign measurement, or ad personalization.
Store preferences or enable non-essential external content.



 Data Science student Stefano Costantini ’15 has posted