Automation and Sectoral Reallocation

Article by Dennis Hutschenreiter, Tommaso Santini, and Eugenia Vella

Illustration of a robot sitting on a scale while workers move to the other side
Original artwork by Angelica Lena

In this paper, we study the sectoral reallocation of employment due to automation in Germany. Empirical evidence by Dauth et al. (2021) shows that robot adoption has induced a shift of employment from the manufacturing to the service sector, leaving total employment unaffected. We rationalize this evidence through the lens of a two-sector, general equilibrium model with matching frictions and endogenous participation.

Few papers have studied the effect of automation on employment in a multi-sectoral model. Berg et al. (2018) argue that the inclusion of a non-automatable sector amplifies the difference between the effect of automation on low- and high-skill workers. Sachs et al. (2019) also include a non-automatable sector in an overlapping generations model. They study the possibility of one generation improving their welfare at future generations’ expense through robot adoption. To the best of our knowledge, we are the first to build a two-sector general equilibrium model with search and matching frictions to analyze the long-run impact of automation on both sectoral and aggregate employment.

We consider a representative household that decides how to allocate its members between non-participants in the labor markets, job-searchers in manufacturing, and job-searchers in services. The household also accumulates capital. On the production side, there is a representative firm in each sector. The manufacturing firm decides how many vacancies to post and how much capital to borrow from the household. Automation increases the capital intensity of the technology in the manufacturing sector. This can be motivated by the idea that some work operations, formerly performed by humans, are now executed by robots (Acemoglu and Restrepo (2018)). In the service sector, we assume for simplicity that no capital is needed, and thus the representative firm decides only the number of vacancies to post.
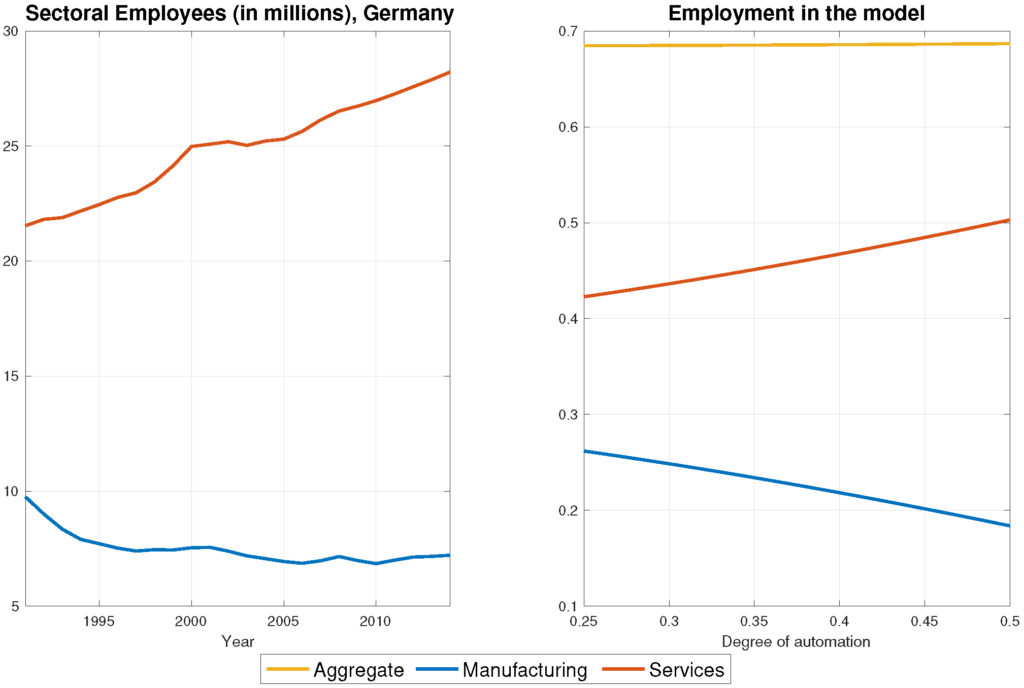
Two panels plot sectoral employees in Germany and employment in the model

Key takeaways

After calibrating our model to the German economy in 1994, we perform steady-state comparative statics to study the long-run impact of automation on sectoral reallocation of employment. As the stock of robots increased by 87% in Germany between 1994 to 2014, we can qualitatively compare the model economy’s reaction to an increase in the degree of automation with the sectoral employment shares we observe in Germany over time.

The right panel of Figure 1 shows the model implied values of sectoral employment levels together with total employment. A higher degree of automation, which we take as a proxy of robot adoption, increases employment in services and decreases it in manufacturing. Despite the adjustments of sectoral employment, total employment remains constant, consistently with the empirical evidence of Dauth et al. (2021). In the left panel of Figure 1, we plot the employment shares in the German economy, which we compute using data from the German Federal Statistical Office (DESTATIS). The model qualitatively replicates the observed pattern in sectoral employment.

To assess how well our model can explain the sectoral reallocation of employment in Germany, we focus on comparing two steady states. These two steady states correspond to the start and end years in the empirical analysis of Dauth et al. (2021). The model predicts a decline of 27% in the ratio of manufacturing employment to service employment, which is reasonably close to the one found in the aggregate data for the German economy, i.e., 32%.

Having shown that the model replicates the sectoral reallocation we observe in the data, we then ask the following question. What determines the extent of sectoral reallocation?

Two main parameters govern the strength of the sectoral reallocation of employment in the model: (1) the elasticity of substitution between capital and labor in the manufacturing sector α and (2) the elasticity of substitution between the outputs of the two sectors χ. Intuitively, in the first case, as α decreases, capital and labor become stronger complements in the production of the manufacturing good. As automation raises the return of capital for a given capital stock, in the long-run this leads to a higher capital stock in the steady state. The stronger the complementarity between the two inputs in manufacturing (i.e., the lower α), the higher is the relative demand for manufacturing workers. Therefore, the sectoral reallocation of employment due to automation is mitigated for lower values of α, as Figure 2 demonstrates.
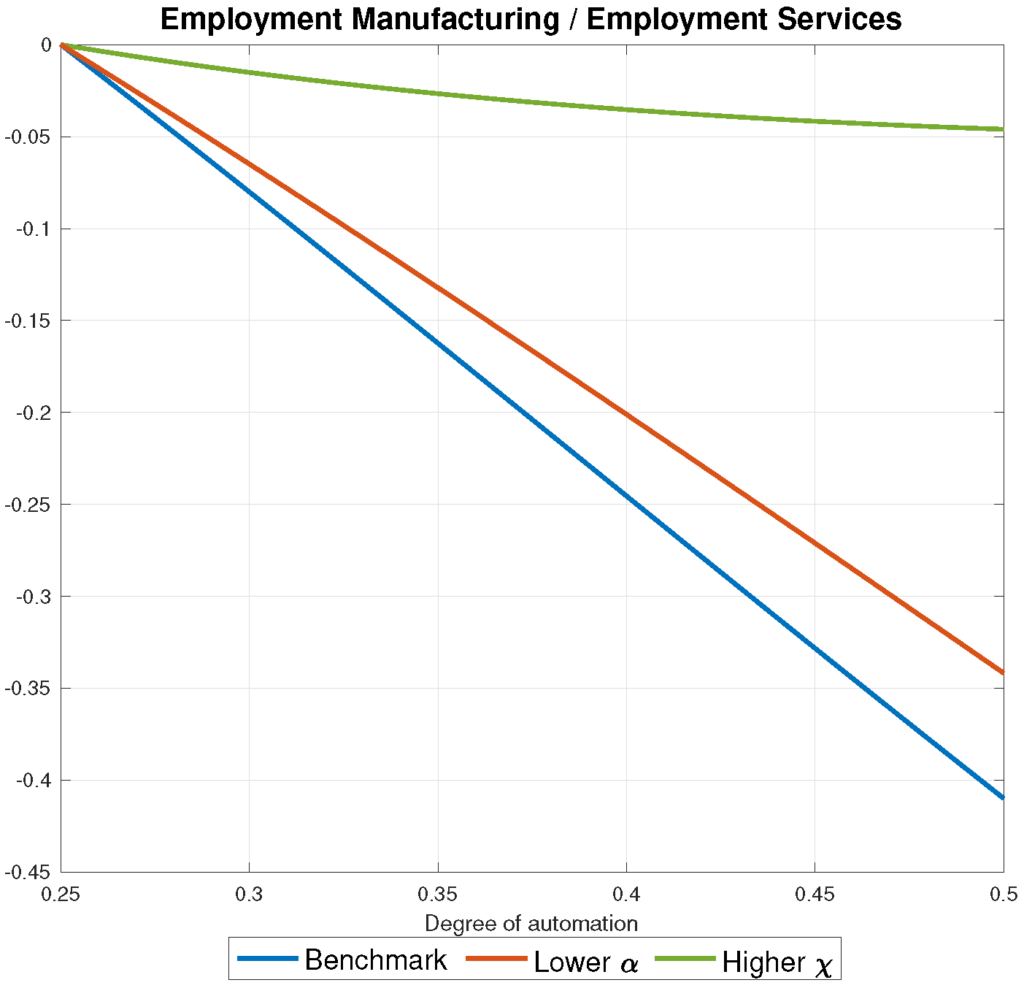
Figure plots employment and degree of automation
Note: The plotted variables are normalized to zero in the initial steady state. α denotes the elasticity of substitution between capital and labor in manufacturing production. χdenotes the elasticity of substitution between the two sectoral goods.

Concerning the second parameter, we need to distinguish two different effects on production and employment in the service sector. Firstly, since automation leads to a higher accumulation of capital in the long run and, thus, to higher household wealth, this will lead to a higher demand for services, which is a normal good. Secondly, the stronger is the complementarity between the two goods in the economy, the higher is the increase in the demand for services. Consequently, a higher substitutability (i.e., a higher χ) between service and manufacturing goods mitigates the increase in the demand for services and, thus, the sectoral reallocation of employment, as Figure 2 shows.

Conclusion

To sum up, we build a general equilibrium model with an automatable and a non-automatable sector and labor market frictions that is able to rationalize the empirical evidence presented by Dauth et al. (2021) on (i) the substantial sectoral reallocation of employment and (ii) the null-effect on total employment. We show that our calibrated model can reasonably explain the empirical strength of the sectoral reallocation of labor. Furthermore, we analyze which key parameters govern the magnitude of this effect in the model.

An interesting extension of our model would be to include heterogeneous agents and capital-skill complementarity (see e.g. Dolado et al. (2021) and Santini (2021)). With that extended framework, one could study the interplay between automation, sectoral automation, and inequality. We leave this topic for future research.

References

Connect with the authors

portrait

Dennis Hutschenreiter is a PhD candidate in the IDEA Program (UAB and Barcelona GSE).

portrait

Tommaso Santini is a PhD candidate in the IDEA Program (UAB and Barcelona GSE)

portrait

Eugenia Vella is a Research fellow at AUEB, ELIAMEP, and MOVE.

Within-Group Heterogeneity in a Multi-Ethnic Society

Nada es Gratis article by Miriam Artiles ’15 (Economics)

Photo by Adrian Dascal on Unsplash

Editor’s note: this article was originaly published in Spanish in the popular economics blog, Nada es Gratis, and is based on Miriam Artiles’s PhD from Universitat Pompeu Fabra. Her Job Market Paper was honorably mentioned in the third annual Nada es Gratis Job Market Paper awards.

Is ethnic diversity good or bad for economic development? When different languages, ethnicities or races coexist in the same society, there are challenges for the economy, but also opportunities. On one hand, if individuals within ethnic groups are homogeneous, and groups differ in preferences toward policies or public goods, then conflicting preferences can lead to inefficiencies in public good provision or to policy choices that may not benefit the entire society. Inter-group tensions can also result in civil conflicts or exacerbate mistrust and lack of cooperation. However, on the other hand, if ethnic groups differ in subsistence activities or skills, then complementary specializations can generate economic gains, stimulate innovation, and promote inter-group trade. Alesina and La Ferrara (2005) provide a review of this literature. While there is a general understanding that diversity brings opportunities and challenges, there is scarce evidence on which factors determine its positive or negative consequences. When is ethnic diversity good for economic development, and when is it bad?

I ask whether the effect of ethnic diversity on economic development depends on one characteristic of ethnic groups that has received little attention: the heterogeneity of individuals within ethnic groups. Underlying previous literature is the assumption that individuals within ethnic groups tend to be homogeneous. However, individuals may differ in many dimensions, including preferences, economic activities or skills, as well as cultural, genetic, and linguistic traits. I focus on having different economic specializations and skills within the same ethnic group, and I study whether ethnic groups with more heterogeneous individuals do better in multi-ethnic societies.

Consider two ethnic groups, A and B. The two groups differ in ethnicity. In turn, ethnic group A has individuals with diverse skills due to their different economic specializations, while ethnic group B is more homogeneous (individuals from ethnic group B have similar skills). The idea is that it may be easier for individuals of ethnicity A to live and to interact in a multi-ethnic society–they come from an ethnic group that is already highly heterogeneous. They will already be used to diverse environments. They will be more familiar with having to interact with heterogeneous individuals. If you come from an ethnic group that is highly heterogeneous, in terms of skills, you may be more willing to live and to interact with other ethnicities. In this case, positive interactions, mutually beneficial exchange, between ethnic groups will become more frequent.

The 16th Century resettlement of Peruvian ethnic groups

To study this, I collect new data on a natural experiment from Peru’s colonial history. I focus on highland Peru. There, Spanish colonizers resettled native populations in the 16th century. They forced together different ethnic groups in new villages, and this happened unintentionally. Importantly, in some ethnic groups, individuals had already been living in very different ecological zones of the Andes, at different altitudes, during the pre-colonial period, before the Spanish conquest. This creates within-group heterogeneity. In some cases, individuals from the same ethnic group were very different in terms of ecological specializations and skills – the types of lands and crops that they were used to cultivate. In other ethnic groups, everyone lived in the same climate zone, at the same altitude. I am asking: did the more heterogeneous ethnic groups do better once they were resettled in multi-ethnic villages?

Firstly, I use a map of the spatial distribution of ethnic groups at the time of the Spanish conquest. It allows me to compute the distance from each village to the closest ethnic frontier and use it as a source of quasi-random variation in ethnic diversity. During the pre-colonial period, individuals from the same ethnic group were distributed vertically, at different altitudes. This is the thesis of the anthropologist John Murra. He documents this vertical settlement pattern as a subsistence strategy in an environment in which differences in elevation create a variety of ecological zones and climates. At the time of the resettlement, the mountain environment of the Andes was new to Spanish colonizers – they were used to a flatter world. As a result, in villages that were created close to ethnic borders, they concentrated individuals from different ethnicities unintentionally (Pease 1978; Wachtel 1976). Secondly, I use spatial data on the distribution of ecological zones to compute a proxy for the heterogeneity of skills within each ethnic group prior to the conquest. It is important to note that ethnic groups with more heterogeneous skills may be different in other dimensions (e.g., group size, population density, etc). In the analysis, I use all the available data on the pre-colonial characteristics of ethnic groups to account for the main correlates of within-group heterogeneity.

The first result in the paper documents the direct effect of ethnic diversity, which I benchmark against previous results in the literature. I find that ethnic diversity is robustly associated with lower living standards in the long run. Specifically, I explore a variety of outcomes that capture contemporary living standards. As proxies for local economic activity, I use light intensity per capita (2000-2003) and a measure of non-subsistence agriculture from the agricultural census of 1994. For access to public infrastructure, I use data from the 1993 population census on access to public sanitation and the public network of water supply. This result is in line with the literature on the costs of ethnic diversity, though it also highlights the persistent consequences of forced diversity at the local level. When examining the effect of ethnic diversity and within-group heterogeneity, I find the following pattern:

The figure shows the average effect size of ethnic diversity as a function of within-group heterogeneity. I find a robust pattern: the more heterogeneous an ethnic group was prior to resettlement, the lower the cost of ethnic diversity. On average, where ethnic groups have more heterogeneous individuals in terms of skills, the negative effect of ethnic diversity is reduced, and ethnic diversity may even become an advantage for economic development. To understand the evolution of these long-term effects, I use data from the 1876 population census on occupations and literacy rates, showing that the documented pattern persists over time.

Why is this happening? When exploring potential channels, I find evidence consistent with cultural transmission. Individuals from more heterogeneous ethnic groups in terms of skills are more likely to interact with other ethnicities. Using data from colonial records, I find evidence suggesting cooperative behavior and more open attitudes when interacting with other ethnic groups. Overall, understanding whether individuals from more heterogeneous ethnic groups are better able to integrate in a multi-ethnic society is a relevant question, not only in an increasingly globalized world, but also in the context of forced displacements and migrations, like in the case of refugees.

References

Alesina, A., and La Ferrara, E. (2005). “Ethnic Diversity and Economic Performance.” Journal of Economic Literature, 43 (3), pp. 762-800.

Murra, J. V. (1975). Formaciones económicas y políticas del mundo andino. Instituto de Estudios Peruanos.

Pease, F. G. Y. (1978). Del Tawantinsuyu a la historia del Perú, Instituto de Estudios Peruanos.

Wachtel, N. (1976). Los vencidos: los indios del Perú frente a la conquista española (1530-1570). Alianza.

Connect with the author

Miriam Artiles ’15 is a PhD candidate in Economics at Universitat Pompeu Fabra and will soon start as an Assistant Professor at Pontificia Universidad Católica de Chile. She is an alum of the Barcelona GSE Master’s in Economics.

This post was edited by Ashok Manandhar ’21 (Economics).

Environmental Investment Tax Incentive Reform in Spain: a Lost Opportunity?

Nada es Gratis article by Kinga Tchórzewska ’15 (Economics)

Photo by Clayton Cardinalli on Unsplash

Editor’s note: this article was originaly published in Spanish in the popular economics blog, Nada es Gratis, and is based on Kinga Tchórzewska’s PhD from the University of Barcelona. Her Job Market Paper was honorably mentioned in the third annual Nada es Gratis Job Market Paper awards.

Firms are often reluctant to invest in green technology. As for the reason why – they point to high fixed costs and the resulting capital market failure. However, instruments that could possibly address this problem, such as environmental investment tax incentives, are not very popular among regulators – even though they may offer an interesting alternative to environmental taxation or even investment subsidies, since tax incentives are easier to implement at the administrative level. Could Environmental Investment (EI) tax incentives be successful at encouraging green investment? And how do firms react to the modifications in existing EI tax credits with respect to employment and innovation decisions? I try to tackle those questions using the EI tax credit reform in Spain.

Spanish Environmental Investment (EI) Tax Credit

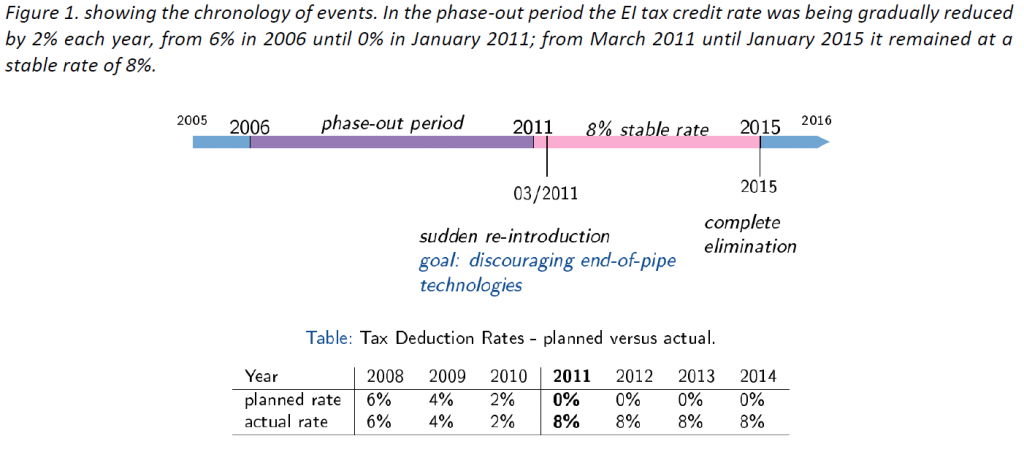
Spain is a very interesting country in which to study a large-scale national tax incentive program because the EI tax credit went through some unusual transformations over the years of its existence. The specific EI tax incentive analyzed in this paper was first introduced in 1996 at 10% of the firm’s level of investment and survived in such form until 2006, when its slow phase-out was announced. The phase-out was implemented as the then government believed that the tax incentive was mostly financing end-of-pipe technologies (which do not affect the production process but purely reduce the pollution level at the end of the production line e.g. filters and sulphur scrubbers) rather than cleaner production technologies, very often required by law already. The phase-out was then successfully continued until tax credit’s complete elimination in January 2011. Unexpectedly, in March of 2011, this tax credit was re-introduced for 4 more years at the stable rate of 8% investment level. It was possibly done to mediate the effect of the financial crises on the industrial sectors. Figure 1. shows the chronology of events and the expected versus actual rates of the tax credit.

What makes this EI tax credit reform especially interesting is that it generated a lot of confusion until the very last moment and while introduced in March 2011 – it was done specifically with the intention to favor cleaner production over end-of-pipe technologies. In the analysis, I focus on industrial firms as the main beneficiaries of the program and consider the time period between 2008 and 2014. In the first part, I compare firms’ behavior before and after the change in this policy instrument using difference-in-difference analysis. This will show if the modification of the tax credit discouraged end-of-pipe technologies as well as how the policy reform affected green employment. In the second part of the analysis, by using instrumental variable approach with difference-in-difference, I examine the proportionate effect of an increase in the amount of the tax credit. I study its proportional effect on firms’ investment, employment and R&D outcomes. Thus, I perform the first quasi-experimental econometric analysis of the effectiveness of EI tax credit at encouraging adoption of green technologies directly, but also indirect green employment and green R&D effects.

Results

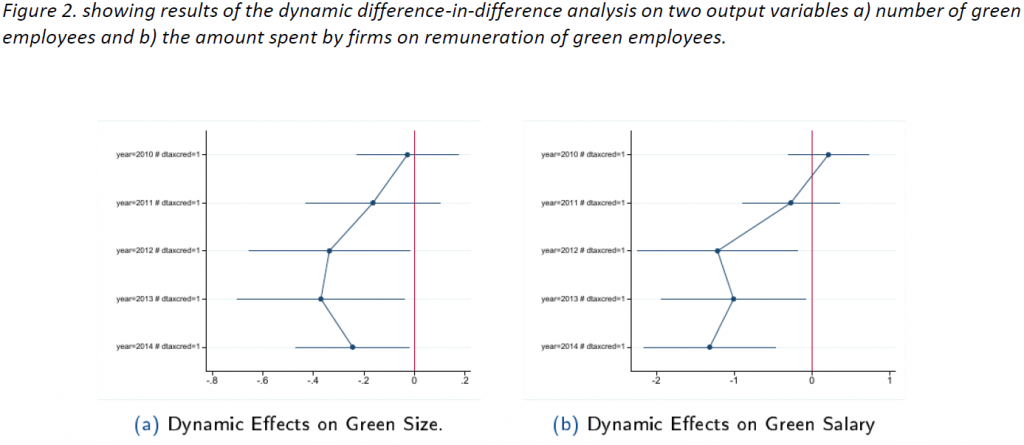
I find evidence that firms did in fact decrease their investment through the tax credit in the end-of-pipe technologies as a result of the policy change. This also includes the technologies specifically reducing air-pollution alone such as filters/sulphur scrubbers. We can, therefore, conclude that the modification was implemented quite successfully. That being said, there is no evidence to support the claim that this policy change led to an increase in the investment in cleaner production technologies. Unfortunately, the policy change also had a few unexpected indirect effects. It appears that firms reduced the number of green employees as well as the expenditure associated with the salaries of green employees, as can be seen in Figures 2a and 2b.

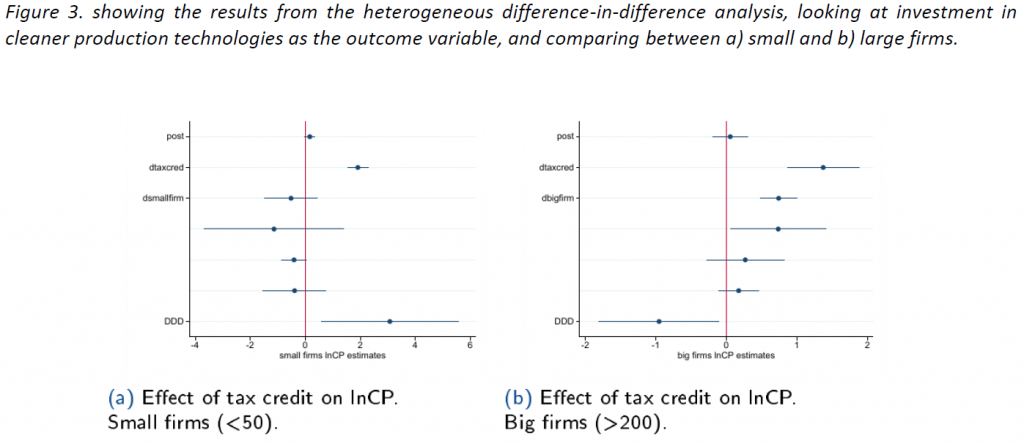
After performing the heterogeneous analyses, it is also clear that firms responded differently depending on their size – Figures 3a and 3b. More specifically, small firms seem to have benefited the most from the policy change, by considerably increasing their investment in cleaner production technologies. The opposite has happened to the large firms, who decreased their investment in the cleaner production technologies through the modified tax incentive.

By studying the proportional effect of the EI tax credit on investment outcomes it becomes apparent that Spanish environmental investment tax incentive was generally successful at inducing all types of green investment. This means that even during times of financial crises tax credit was drove firms’ green investment. However, they favored air-pollution-reducing over energy-efficient technologies, not necessarily end-of-pipe over cleaner production technologies, as per the concern of the government at the time. Additionally, I find further evidence that the increase in the amount of environmental investment tax credit results in a proportionate increase in the number of green employees and even private environmental R&D. Those indirect effects are quite hopeful, showing that a successful EI tax credit can also drive employment and create positive externalities through R&D.

Policy

This analysis provides a multitude of important implications for policy makers. Firstly, it encourages the usage of EI tax credits, which is also in agreement with previous literature, especially the work done by Ohrn (2019). However, this is in stark contrast to the decision of the Spanish government to eliminate this fiscal incentive from the Spanish Corporate Income Tax completely. This analysis supports its continuous use and perhaps even further modification, rather than a complete phase-out.

What we can learn from this green tax incentive is quite straightforward – adopting green depreciation incentives leads to increased business incentives and green employment outcomes, even during times of economic downturn. Additionally, the government can be successful at modifying the existing tax incentives, such that they discourage those technology choices that the central government considers undesirable. While the results clearly indicate that the tax credit should have been redefined even further so as to also encourage more investment in cleaner production technologies, this empirical work does not justify its complete phase-out. The fact that there is an increased investment in cleaner production technologies for smaller firms is also very important, as those are exactly the companies frequently faced with capital market failure – especially in the time of financial recession such as this one.

Of course, more research is needed to assess whether these types of incentives are the most efficient way to improve firms’ economic outcomes, and how the tax credit also affected their employees over the short- and long-run – especially after the complete elimination of the tax credit in 2015. Lastly, even given the financial burden that tax deductions and subsidies entail, they might still be economically justified in some cases. For instance, when positive externalities appear, such as increased green private R&D, which is the case here.

References

Ohrn, E. (2019). The effect of tax incentives on US manufacturing: Evidence from state accelerated depreciation policies. Journal of Public Economics, 180, 104084.

Connect with the author

Kinga B. Tchórzewska ’15 is a Postdoctoral Researcher at the ZEW – Leibniz Centre for European Economic Research. She is an alum of the Barcelona GSE Master’s in Economics.

This post was edited by Ashok Manandhar ’21 (Economics).

Opening the Black Box of Austerity: Evidence from Fiscal Consolidation Plans

Alessandro Franconi ’17 (Macroeconomic Policy and Financial Markets)

In a new LUISS Working Paper, “Opening the Black Box of Austerity: Evidence from Fiscal Consolidation Plans,” Alessandro Franconi ’17 (Macro) explores the effects of austerity measures on labour markets and on income inequality and finds evidence of a mechanism that can mitigate the size of the economic contraction.

Paper abstract

This paper explores the effects of austerity measures on labour markets and on income inequality and finds evidence of a mechanism that can mitigate the size of the economic contraction. The results indicate that: (i) Fiscal consolidation causes greater distortions for the youth, hence they deserve a special attention to avoid severe long-term economic costs. (ii) While at first glance transfers cuts seem to be ideal, a careful examination suggests that these policies can jeopardise the success of fiscal consolidation. (iii) Tax hikes, negatively affecting the productive sector, trigger frictions in the labour market that give rise to recessionary effects. (iv) Spending cuts, targeting public sector wages and employment, can endanger the capabilities of the current and future labour force. (v) Lastly, income inequality increases with tax hikes and spending cuts, whereas the muted response to transfers cuts is explained by the reaction of labour demand.

Connect with the author

Is the COVID-19 pandemic a consumption game changer?

Research co-authored by Alex Hodbod ’12 (ITFD) and Steffi Huber ’10 (Economics)

The CEPR journal on Covid Economics recently included the paper, “Is COVID-19 a consumption game changer? Evidence from a large-scale multi-country survey” by Alexander Hodbod ’12 (ITFD), Cars Hommes, Stefanie J. Huber ’10 (Economics), and Isabelle Salle.

Steffi gave an interview to CEPR’s Tim Phillips about the team’s research:

Policies to avoid zombification of the economy

In an accompanying VoxEU column, the authors discuss the risks that government responses to COVID-19 could “zombify” the economy.

“A representative consumer survey in five EU countries indicates that many consumers do not miss certain goods and services they have cut down on since the COVID-19 outbreak,” the authors explain in their column. “Fiscal policy must recognise that some firms will become obsolete in the altered post-COVID-19 environment. To achieve a swift recovery, these obsolete firms must be allowed to fail fast so that resources can be reallocated to more efficient uses. Instead, fiscal support should be laser-like in targeting those households who are particularly hard hit by the crisis. Such support should be oriented towards helping displaced workers retrain and find new jobs.”

Paper abstract and download

Prospective economic developments depend on the behavior of consumer
spending. A key question is whether private expenditures recover once
social distancing restrictions are lifted or whether the COVID-19 crisis
has a sustained impact on consumer confidence, preferences, and, hence,
spending. Changes in consumer behavior may not be temporary, as they
may reflect long-term changes in attitudes arising from the COVID-19
experience. This paper uses data from a representative consumer survey
in five European countries conducted in summer 2020, after the release
of the first wave’s lockdown restrictions. We document the underlying
reasons for households’ reduction in consumption in five key sectors:
tourism, hospitality, services, retail, and public transports. We identify
a large confidence shock in the Southern European countries and a
permanent shift in consumer preferences in the Northern European
countries. Our results suggest that horizontal fiscal support to all firms
risks creating zombie firms and would hinder necessary structural
changes to the economy.

Connect with the authors

  • Alexander Hodbod ’12 (International Trade, Finance, and Development). Counsellor to ECB Representative to the Supervisory Board, European Central Bank (DGSGO-SO), Frankfurt, Germany.
  • Cars Hommes. Professor of Economic Dynamics at CeNDEF, Amsterdam School of Economics, University of Amsterdam, and research fellow of the Tinbergen Institute, Amsterdam, The Netherlands, Senior Research Director (Financial Markets Department), Bank of Canada.
  • Stefanie J. Huber ’10 (Economics). Assistant Professor at CeNDEF, Amsterdam School of Economics, University of Amsterdam, and research candidate fellow of the Tinbergen Institute, Amsterdam, The Netherlands. 
  • Isabelle Salle. Principal Researcher at the Bank of Canada (Financial Markets Department), research fellow at the Amsterdam School of Economics, University of Amsterdam, and research fellow of the Tinbergen Institute, Amsterdam, The Netherlands. 

The Exploring Happiness Index

A new tool created by Elliot Jones ’18 (Macro Program)

Elliot Jones ’18 (Macroeconomic Policy and Financial Markets) is a Sovereign Credit Risk Analyst at the Bank of England. Together with co-creator Jessica Golding, he has established Exploring Happiness, a research organization that looks to bring produce evidence-based research in order to generate policy recommendations focused towards sustainably increasing wellbeing across all areas of society.

The latest project to come out of the initiative is the Exploring Happiness Index. This is an online tool that anyone can use to help them achieve their goals and to support their mental health.

Learn more about the index in the video and read on to find out how to start using it:

Explaining the concept of the index

Everyone is different and what makes each of us happy is also different. Some people are career-driven, others live for the social scene and some are highly family-orientated. Despite this, we all also have a lot in common – we all value our health, both mental and physical, the quality of our personal relationships matters a lot and we all like to have something to do that makes us feel worthwhile. It is these basic fundamentals that we use to build our index. We take evidence-based research on the main determinants of life satisfaction (which is taken as being synonymous with happiness) to bring together a group of components that we all have in common and these become the building blocks of the index.

Methodology

The differences of users are captured in two main ways – by identifying the circumstances and preferences of each user. When creating an account each user can choose from 13 different individual types such as an employed worker, a student or a retired person. As a result of this choice, the components that make up the index will change to reflect that individual types circumstances (e.g. an employed worker has a ‘Work’ component, a student has an ‘Education’ component and a retired person has neither of these, but greater weight is applied to their ‘Leisure Time’ component). 

Next, users are then able to choose how important each of the components are to them and the weights in the index will shift to reflect these choices. These two steps make the index unique for each user.

Three benefits of using the index

  1. Being informed:  Our decisions, big or small, will play an important role in determining our happiness and we are more likely to make the right decision when we have better information available to draw upon. The usage of this index provides users with this information, perhaps meaning just knowing how happy you are could make you happier.
  2. Mental health tool: Using this index allows users time to reflect, to think about what has been going well and what has been more challenging. There is good evidence available which points to the benefits of self-reflection on mental health. This has been shown for self-reflection in a number of forms (e.g. from expressive writing to gratitude journaling), across various life stages and as an effective treatment for those with diagnosed mental illnesses. Our view, which we intend to robustly test in the future, is that the method of self-reflection that this index requires will boost users resilience and mental wellbeing.
  3. The ultimate tracker: Nowadays, it is not uncommon to track several parts of our lives, from steps to sleep to calories. But what’s the point in tracking these things? For most people, it’s because they believe if they do more steps or sleep better, they will end up feeling better. This index allows you to check whether that’s true in practice.

Get starting with the Exploring Happiness Index

You can create an account here or find out a little more first by heading to the index homepage.

If you have any feedback, please email info@exploringhappiness.co.uk or use the feedback form on our website. 

Elliot Jones ’18 is a Sovereign Credit Risk Analyst at the Bank of England. He is an alum of the Barcelona GSE’s Master’s in Macroeconomic Policy and Financial Markets.

LinkedIn | Exploring Happiness

Does Air Pollution Exacerbate Covid-19 Symptoms? Evidence from France

Economics master project by Mattia Laudi, Hubert Massoni, and James Newland ’20

The Eiffel Tower under a dark red sky
Image by Free-Photos from Pixabay

Editor’s note: This post is part of a series showcasing BSE master projects. The project is a required component of all Master’s programs at the Barcelona School of Economics.

Abstract

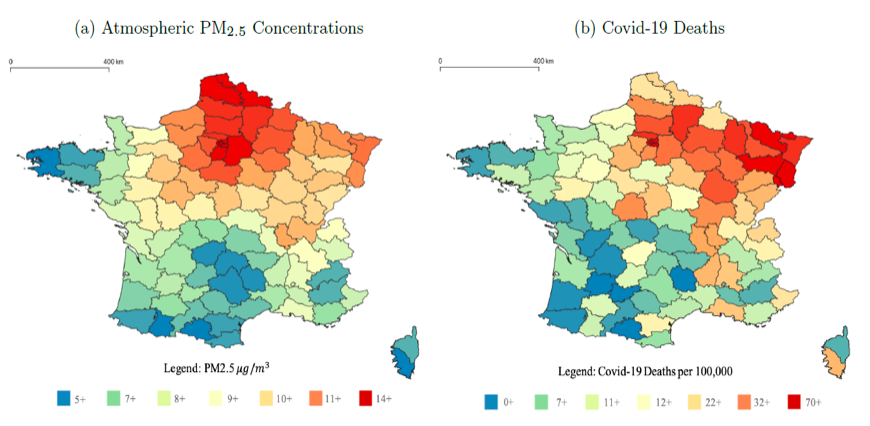
For patients infected by Covid-19, underlying health conditions are often cited as a source of increased vulnerability, of which exposure to high levels of air pollution has proven to be an exacerbating cause. We investigate the effect of long-term pollution exposure on Covid-19 mortality, admissions to hospitals and admissions to intensive care units in France. Using cross-sectional count data at the local level, we fit mixed effect negative binomial models with the three Covid-19 measures as dependent variables and atmospheric PM2.5 concentration (µg/m3) as an explanatory variable, while adjusting for a large set of potential confounders. We find that a one-unit increase in PM2.5 concentration raised on average the mortality rate by 22%, the admission to ICU rate by 11% and the admission to hospital rate by 14% (rates with respect to population). These results are robust to a large set of sensitivity analyses. As a novel contribution, we estimate tangible marginal costs of pollution, and suggest that a marginal increase in pollution resulted on average in 61 deaths and created a 1 million euro surcharge in intensive care treatments over the investigated period (March 19th – May 25th).

A map of air pollution and a map of Covid deaths in France

Conclusions

The study is a strong indication that air pollution is a crucial environmental factor in mortality risks and vulnerability to Covid-19. The health risks associated with air pollution are well documented, but with Covid-19 in the spotlight we hope to increase awareness of the threat caused by pollution, not only through direct increased health risks, but also through external factors, such as pandemics.

We show the aggravating effect of long-term pollution exposure to three levels of severity of Covid-19 symptoms in France: admission to hospitals for acute Covid-19 cases, admission to intensive care units for the most severe vital organ failures, and fatalities (all expressed per 100,000 inhabitants). Using cross-sectional data at the départemental (sub-regional) level, we fit mixed effect negative binomial models with the three Covid-19 measures as dependent variables and the average level of atmospheric concentration of PM2.5 (µg/m3) as an explanatory variable. We adjust for a set of 18 potential confounders to isolate the role of pollution in the spread of the Covid-19 disease across départements. We find that a one-unit increase in average PM2.5 levels increases on average the mortality rate by 22%, the admission to ICU rate by 11% and the admission to hospital rate by 14%. These results are robust to a set of 24 secondary and sensitivity analyses per dependent variable, confirming the consistency of the findings across a wide range of specifications.

We further provide numerical – and hence more tangible – estimates of the marginal costs of pollution since March 19th. Adjusting for under-reporting of Covid-19 deaths, we estimate that long-term exposure to pollution marginally resulted in an average 61 deaths across French départements. Moreover, based on average daily costs of intensive care treatments, we estimate that pollution induced an average 1 million euros in costs borne by hospitals treating severe symptoms of Covid-19. These figures strongly suggest that areas with greater air pollution faced substantially higher casualties and costs in hospital services, and raise concerns about misallocation of resources to the healthcare system in more polluted areas.

Our paper provides precise estimates and a reproducible model for future work, but is limited by the novelty of the phenomenon at the centre of the study. Our empirical investigation is restricted to the scope of France alone due to cross-border inconsistencies in Covid-19 data collection and reporting. Once Covid-19 data reporting is complete and consistent, we hope future studies will examine the effects of air pollution at a greater scale, or in greater detail. On the other hand, more disaggregated data – at the individual or hospital level – would allow more precise estimates and a better understanding of key factors of Covid-19 health risks and would also allow the use of surface-measured air pollution. Measured pollution data is available for France, but is inherently biased when aggregated at the départemental level, due to lack of territorial coverage. If precise data tracking periodic Covid-19 deaths becomes available for a wider geographic region, we specifically recommend a MENB panel regression incorporating a PCFE for spatially correlated errors. This will produce the most accurate estimates.

Going forward, more accurate and granular data should motivate future research to uncover the exact financial costs attributable to air pollution during the pandemic. Precise estimation of costs of Covid-19 treatments and equipment (e.g. basic protective equipment for personnel or resuscitation equipment), should feature in a more accurate cost analysis. Hospital responses should be thoroughly analysed to understand the true cost of treatments across all units.

It is crucial that the healthcare costs of pollution are globally recognised so that future policy decisions take them into account. Ultimately, this paper stresses that failure to manage and improve ambient air quality in the long run only magnifies future burdens on healthcare resources, and cause more damage to human life. During a global pandemic, the costs of permitting further air pollution appears ever more salient.

Connect with the authors

About the BSE Master’s Program in Economics

Demand Estimation in a Two-Sided Market: Viewers and Advertisers in the Spanish Free-to-Air TV Market

Competition and Market Regulation master project by Sully Calderón and Aida Moreu ’20

Photo by Glenn Carstens-Peters on Unsplash

Editor’s note: This post is part of a series showcasing BSE master projects. The project is a required component of all Master’s programs at the Barcelona School of Economics.

Abstract

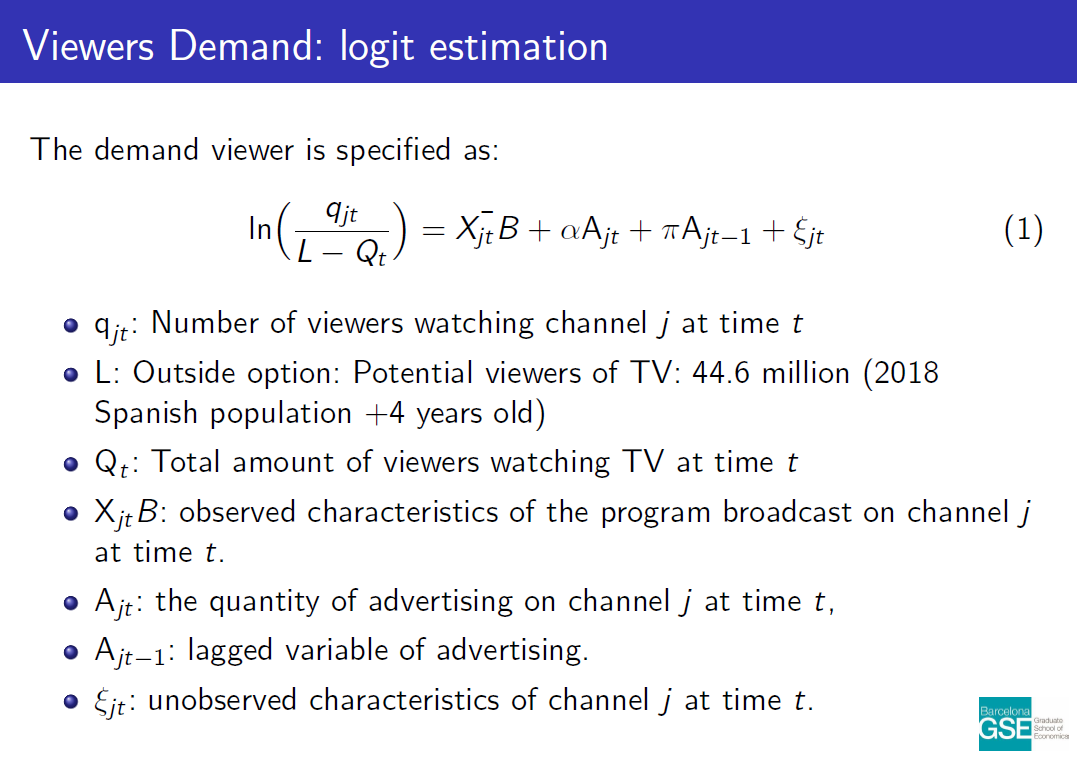
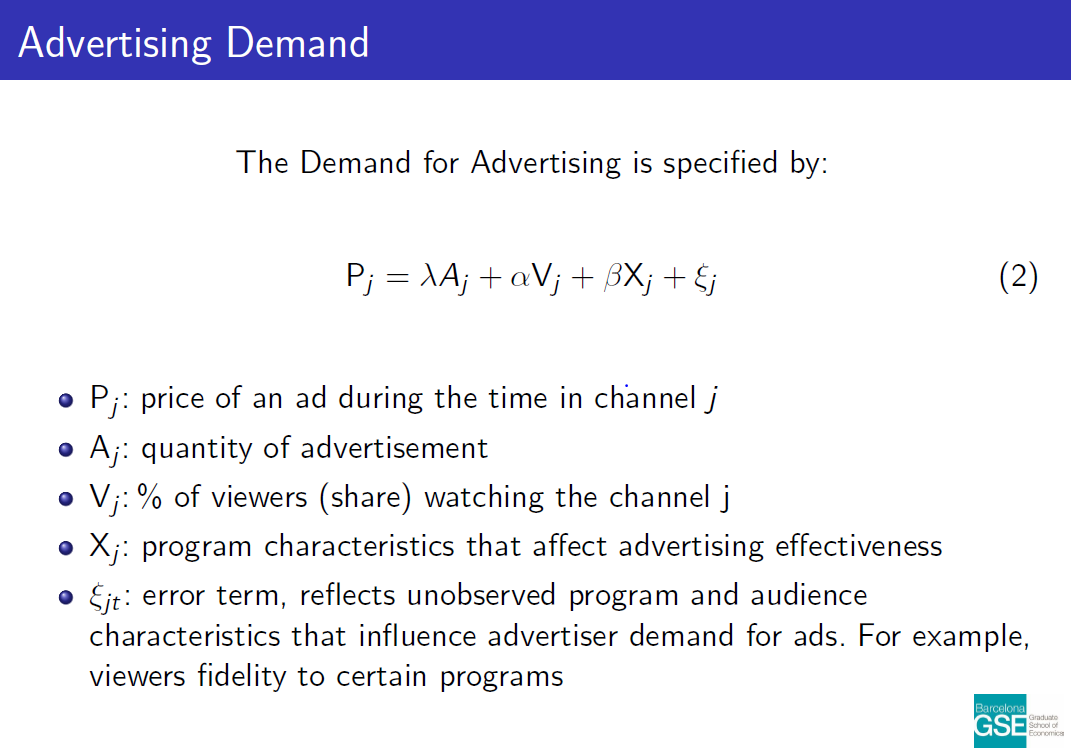
Our research arises in a context where “free” services in one market cannot be understood without taking into consideration the other side of the market. The Spanish free-to-air TV industry is a two-sided market in which viewers demand TV programs (for free) and advertisers demand advertising spots for which they pay a price that depends mainly on audience.  Our main contribution to the two-sided market literature is estimating both viewers and advertisers demand to be able to understand the interactions of both sides of the free-to-air TV market.

This analysis is carried out by developing an econometric analysis of the free to air TV market in Spain that captures the reaction of viewers to a change in advertising quantity and the effect on price of ads that this would bring. We specified Viewers Demand in the Spanish free-to-air TV through a logit model to analyse the impact of advertising minutes on the audience share and, we specified Advertisers Demand by an adaptation of the model of Wilbur (2008) to understand the effect of audience share and advertising quantity on prices of ads.  

Conclusions

The results of the Viewers Demand model show an elastic demand and that viewers are averse to advertising regardless of the day but during prime time they are a bit more ad tolerant, especially from 10pm to 11 pm. 

Logit estimation of Viewers Demand. Download the paper to read text version.

On the other side of the market, the Advertising Demand model shows that advertisers are relatively inelastic to both an increase of adds and an increase in audience share. This may be due to the fact that the data available for this project is precisely coming from the most viewed channels, for which advertisers would have more inelastic demand.

Logit estimation of Advertising Demand. Download the paper to read text version.

As expected, the results show that advertisers are more elastic with regards to audience share than to quantity of advertising.

Connect with the authors

  • Sully Calderón, Economic Advisor at Comisión Federal de Competencia Económica (México)
  • Aida Moreu, Research Analyst at Compass Lexecon (Madrid)

About the BSE Master’s Program in Competition and Market Regulation

Tracking the Economy Using FOMC Speech Transcripts

Data Science master project by Laura Battaglia and Maria Salunina ’20

Editor’s note: This post is part of a series showcasing BSE master projects. The project is a required component of all Master’s programs at the Barcelona School of Economics.

Abstract

In this study, we propose an approach for the extraction of a low-dimensional signal from a collection of text documents ordered over time. The proposed framework foresees the application of Latent Dirichlet Allocation (LDA) for obtaining a meaningful representation of documents as a mixture over a set of topics. Such representations can then be modeled via a Dynamic Linear Model (DLM) as noisy realisations of a limited number of latent factors that evolve with time. We apply this approach to Federal Open Market Committee (FOMC) speech transcripts for the period of Greenspan presidency. This study serves as exploratory research for the investigation into how unstructured text data can be incorporated into economic modeling. In particular, our findings point at the fact that a meaningful state-of-the-world signal can be extracted from expert’s language, and pave the way for further exploration into the building of macroeconomic forecasting models, and in general into the usage of variation in language for learning about latent economic conditions.

Key findings

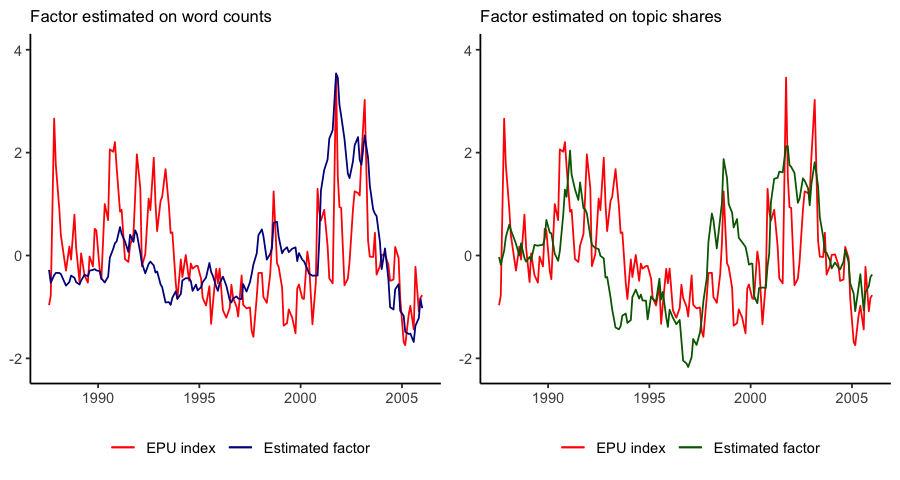
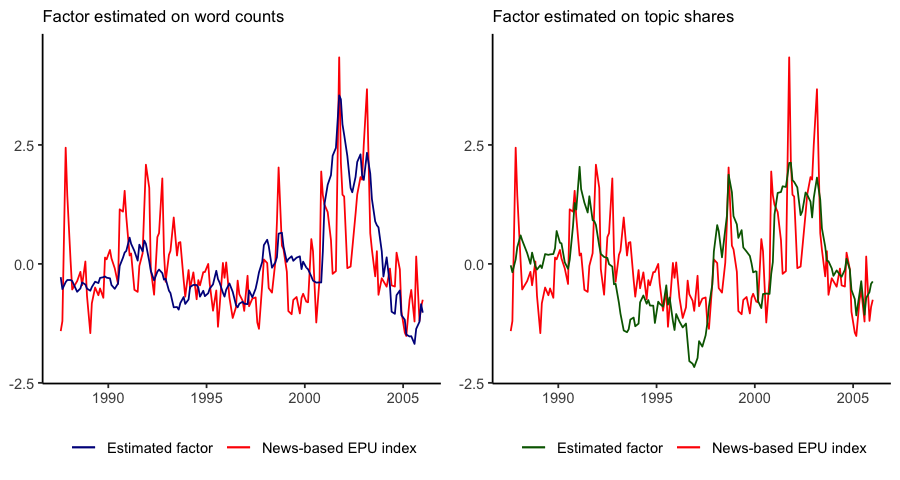
In our paper, we develop a sequential approach for the extraction of a low-dimensional signal from a collection of documents ordered over time. We apply this framework to the US Fed’s FOMC speech transcripts for the period 08-1986 to 01-2006. We retrieve estimates for a single latent factor, that seem to track fairly well a specific set of topics connected with risk, uncertainty, and expectations. Finally, we find a remarkable correspondence between this factor and the Economic Policy Uncertainty Indices for United States.

figure
figure

Connect with the authors

About the BSE Master’s Program in Data Science Methodology

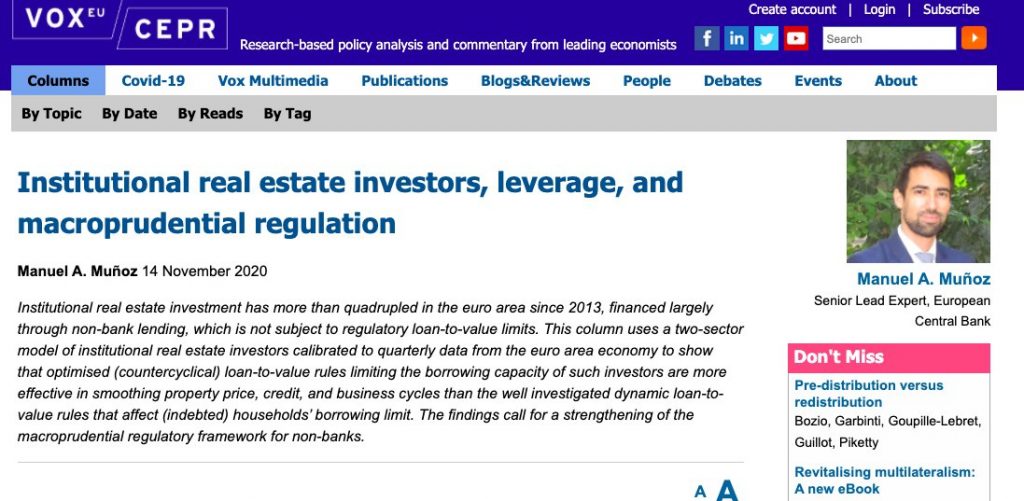
Institutional real estate investors, leverage, and macroprudential regulation

VoxEU article by Manuel A. Muñoz ’13 (Macroeconomic Policy and Financial Markets)

I am honoured to share my new VoxEU article (with you), which I believe it’s relevant for the ongoing debate on how to strengthen the macroprudential regulatory framework for nonbanks:

Ensuring that institutional real estate investors are subject to countercyclical leverage limits would be particularly effective in smoothing the housing price and the credit cycle.


In addition, the associated ECB working paper suggests that this type of regulation would allow for rental housing prices to increase less abruptly during the boom, an issue that policymakers in several countries of the euro area have attempted to handle via price regulation (an alternative that could generate price distortions).

Also on VoxEU by Manuel A. Muñoz

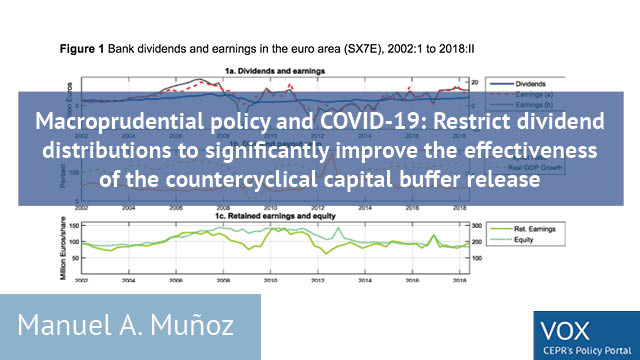
Macroprudential policy and COVID-19: Restrict dividend distributions to significantly improve the effectiveness of the countercyclical capital buffer release (July 2020)

Connect with the author

alumni

Manuel A. Muñoz ’13 is Senior Lead Expert at the European Central Bank. He is an alum of the Barcelona GSE Master’s in Macroeconomic Policy and Financial Markets.

Are you a BSE alum with a new paper or project to share? 
Learn how to submit your work to the Voice!